Statistical Profile of Older Americans Aged 65+
advertisement
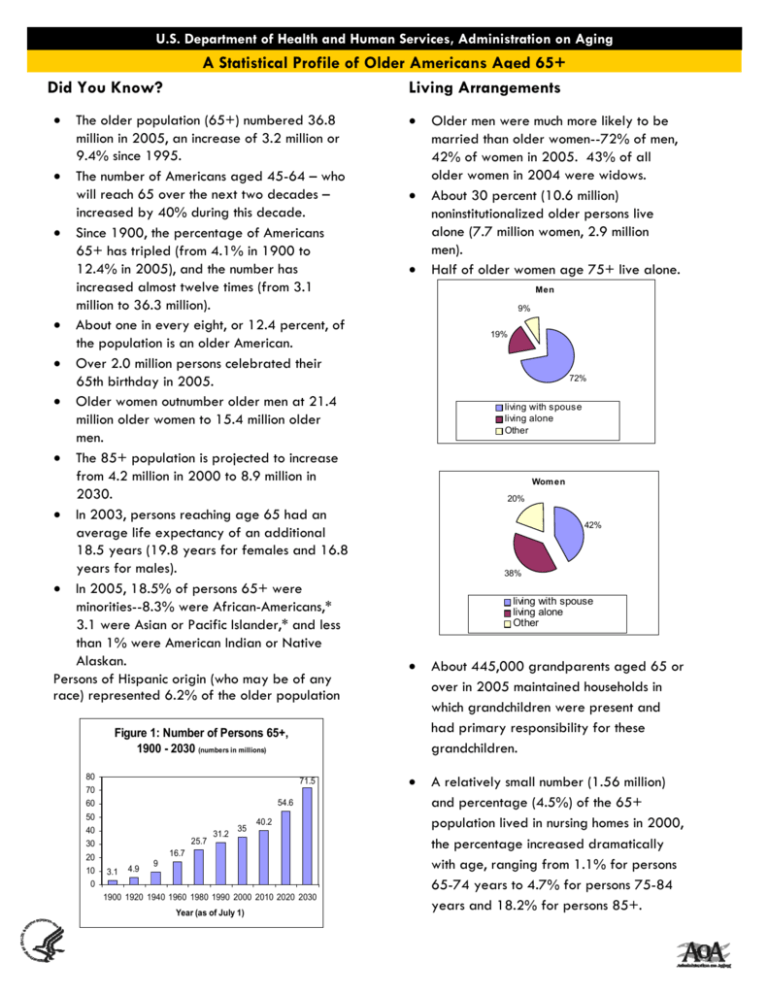
U.S. Department of Health and Human Services, Administration on Aging A Statistical Profile of Older Americans Aged 65+ Living Arrangements Did You Know? • The older population (65+) numbered 36.8 million in 2005, an increase of 3.2 million or 9.4% since 1995. • The number of Americans aged 45-64 – who will reach 65 over the next two decades – increased by 40% during this decade. • Since 1900, the percentage of Americans 65+ has tripled (from 4.1% in 1900 to 12.4% in 2005), and the number has increased almost twelve times (from 3.1 million to 36.3 million). • About one in every eight, or 12.4 percent, of the population is an older American. • Over 2.0 million persons celebrated their 65th birthday in 2005. • Older women outnumber older men at 21.4 million older women to 15.4 million older men. • The 85+ population is projected to increase from 4.2 million in 2000 to 8.9 million in 2030. • In 2003, persons reaching age 65 had an average life expectancy of an additional 18.5 years (19.8 years for females and 16.8 years for males). • In 2005, 18.5% of persons 65+ were minorities--8.3% were African-Americans,* 3.1 were Asian or Pacific Islander,* and less than 1% were American Indian or Native Alaskan. Persons of Hispanic origin (who may be of any race) represented 6.2% of the older population • • • Men 9% 19% 72% living with spouse living alone Other Wom en 20% 42% 38% living with spouse living alone Other • About 445,000 grandparents aged 65 or over in 2005 maintained households in which grandchildren were present and had primary responsibility for these grandchildren. • A relatively small number (1.56 million) and percentage (4.5%) of the 65+ population lived in nursing homes in 2000, the percentage increased dramatically with age, ranging from 1.1% for persons 65-74 years to 4.7% for persons 75-84 years and 18.2% for persons 85+. Figure 1: Number of Persons 65+, 1900 - 2030 (numbers in millions) 80 71.5 70 54.6 60 50 40 25.7 30 35 40.2 16.7 20 10 0 31.2 3.1 4.9 9 1900 1920 1940 1960 1980 1990 2000 2010 2020 2030 Year (as of July 1) Older men were much more likely to be married than older women--72% of men, 42% of women in 2005. 43% of all older women in 2004 were widows. About 30 percent (10.6 million) noninstitutionalized older persons live alone (7.7 million women, 2.9 million men). Half of older women age 75+ live alone. Page 2 Working to Build the Future of Long Term Care Income and Poverty • The median income of older persons in 2005 was $21,784 for males and $12,495 for females. Median money income of all households headed by older people rose by 2.8% from 2004 to 2005. • Households containing families headed by persons 65+ reported a median income in 2005 of $37,765 ($39,402 for non-Hispanic Whites, $27,270 for African-Americans, $49,163 for Asians, and $26,681 for Hispanics). Family Households 65+ Householder 0.0% 5.0% 10.0% Under $10,000 4.4% $10,000 - $14,999 5.5% 15.0% 20.0% 20.6% $15,000 - $24,999 $25,000 - $34,999 18.1% 18.3% $35,000 - $49,999 $50,000 - $74,999 $75,000 and over 25.0% 16.5% 16.7% $37,765 median for 12.2 million family households 65+ The major sources of income as reported by the Social Security Administration for older persons in 2004 were: • Social Security (reported by 89% of older persons), • income from assets (reported by 55%), • private pensions (reported by 29%), • government employee pensions (reported by 14%), and • earnings (reported by 24%). In 2004, Social Security benefits accounted for 39% of the aggregate income of the older population. The bulk of the remainder consisted of earnings (26%), asset income (13%), and pensions (20%). About 3.6 million elderly persons (10.1%) were below the poverty level in 2005. This change in the poverty rate was not statistically different from the poverty rate in 2004. Another 2.3 million or 6.6% of the elderly were classified as "near-poor" (income between the poverty level and 125% of this level). Health and Chronic Conditions In 2004-2005, 38.1% of noninstitutionalized older persons assessed their heath as excellent or very good (compared to 66.0% for persons aged 1864). There was little difference between the sexes on this measure, but African-Americans* (25.1%), older American Indians/Alaska Natives (28.2%) and older Hispanics (28.6%) were less likely to rate their health as excellent or good than were older Whites* (39.6%) or older Asians (34.6%). Most older persons have at least one chronic condition and many have multiple conditions. Among the most frequently occurring conditions of elderly in 2003-2004 were: • hypertension (52%), • diagnosed arthritis (50%), • all types of heart disease (32%), • any cancer (21%), • diabetes (17.0), and • sinusitis (14%). * Figure does not include persons of Hispanic origin. For More Information AoA recognizes the importance of making information readily available to consumers, professionals, researchers, and students. Our website provides information for and about older persons, their families, and professionals involved in aging programs and services. For more information about AoA, please contact: US Dept of Health and Human Services, Administration on Aging, Washington, DC 20201; phone (202) 619-0724; fax (202) 357-3523; Email: aoainfo@aoa.gov or contact our website at www.aoa.gov Administration on Aging | Fact Sheet November 2006


