Location
The Heart
To Accompany: Anatomy and Physiology Text and
Laboratory Workbook, Stephen G. Davenport, Copyright
2006, All Rights Reserved, no part of this publication can be
used for any commercial purpose. Permission requests
should be addressed to Stephen G. Davenport, Link
Publishing, P.O. Box 15562, San Antonio, TX, 78212
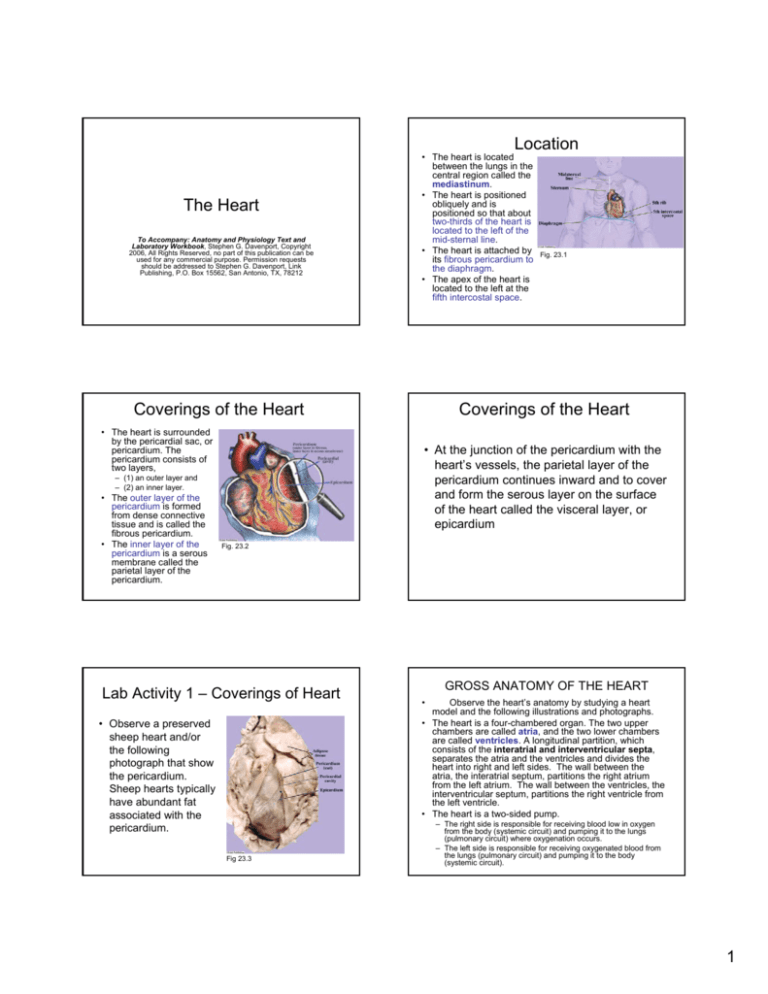
• The heart is located
between the lungs in the
central region called the
mediastinum.
• The heart is positioned
obliquely and is
positioned so that about
two-thirds of the heart is
located to the left of the
mid-sternal line.
• The heart is attached by
its fibrous pericardium to
the diaphragm.
• The apex of the heart is
located to the left at the
fifth intercostal space.
Coverings of the Heart
• The heart is surrounded
by the pericardial sac, or
pericardium. The
pericardium consists of
two layers,
Coverings of the Heart
• At the junction of the pericardium with the
heart’s vessels, the parietal layer of the
pericardium continues inward and to cover
and form the serous layer on the surface
of the heart called the visceral layer, or
epicardium
– (1) an outer layer and
– (2) an inner layer.
• The outer layer of the
pericardium is formed
from dense connective
tissue and is called the
fibrous pericardium.
• The inner layer of the
pericardium is a serous
membrane called the
parietal layer of the
pericardium.
Fig. 23.1
Fig. 23.2
Lab Activity 1 – Coverings of Heart
• Observe a preserved
sheep heart and/or
the following
photograph that show
the pericardium.
Sheep hearts typically
have abundant fat
associated with the
pericardium.
Fig 23.3
GROSS ANATOMY OF THE HEART
•
Observe the heart’s anatomy by studying a heart
model and the following illustrations and photographs.
• The heart is a four-chambered organ. The two upper
chambers are called atria, and the two lower chambers
are called ventricles. A longitudinal partition, which
consists of the interatrial and interventricular septa,
separates the atria and the ventricles and divides the
heart into right and left sides. The wall between the
atria, the interatrial septum, partitions the right atrium
from the left atrium. The wall between the ventricles, the
interventricular septum, partitions the right ventricle from
the left ventricle.
• The heart is a two-sided pump.
– The right side is responsible for receiving blood low in oxygen
from the body (systemic circuit) and pumping it to the lungs
(pulmonary circuit) where oxygenation occurs.
– The left side is responsible for receiving oxygenated blood from
the lungs (pulmonary circuit) and pumping it to the body
(systemic circuit).
1
GROSS ANATOMY OF THE HEART
• Atrial Myocardium
– The myocardium of each atrium is called an auricle
because of its “ear,” or “auricle” shape. The atrial
myocardium is thin and functions by its contraction to
push blood into the ventricles.
• Ventricular Myocardium
– The myocardium of the ventricles is referred to as
ventricular myocardium. The myocardium of the left
ventricle is thicker than that of the right ventricle.
GROSS ANATOMY OF THE HEART
Fig 23.4
Valves of the Heart
• Atrial contraction pushes blood into the ventricles
through one-way valves called atrioventricular (AV)
valves. The atrioventricular valves (located between the
atria and ventricles) are the tricuspid on the right side
and the mitral (or bicuspid) on the left side. During
the contraction of the ventricles the atrioventricular
valves close preventing blood return back into the
atria.
• Blood is ejected through one-way valves at the bases of
the vessels that leave the ventricles. The pulmonary
trunk leaves the right ventricle, and the aorta leaves the
left ventricle. Valves, the pulmonary valve and aortic
valve (or semilunar valves), are located at the bases of
the pulmonary trunk and aorta, respectively. When the
ventricles relax, the pulmonary and aortic valves
(semilunar valves) close and prevent the return of
blood into the ventricles.
GROSS ANATOMY OF THE HEART
Fig 23.5
Fig 23.6
Right Side of Heart
Left Side of the Heart
• Oxygen rich blood enters
the left atrium from the
right and left pulmonary
veins. Blood leaves the
left atrium by way of the
mitral (bicuspid) valve
and enters the left
ventricle. Blood leaves
the left ventricle by way of
the aortic (semilunar)
valve into the aorta. The
aorta directs blood into
the systemic circuit of the
body.
• Blood low in oxygen enters the
right atrium from the superior
and inferior vena cavae and
the coronary sinus. Blood
leaves the right atrium by way
of the tricuspid valve and
enters the right ventricle.
Blood leaves the right ventricle
by way of the pulmonary
(semilunar valve) into the
pulmonary trunk. The
pulmonary truck directs blood
into the pulmonary circuit of
the lungs for gas exchange.
Fig 23.7
Fig 23.8
2
Coronary Arteries
Coronary Circulation
•
The coronary circuit
is the circulatory pathway
through the myocardium
of the heart.
• Arteries
– Oxygen rich blood leaves
the aorta and enters the
two coronary arteries, the
right and left coronary
arteries. The coronary
arteries exit the aorta from
the aortic sinuses, small
dilations located opposite
each cusp of the aortic
(semilunar) valve. Two of
the arotic sinuses, the right
anterior and the left
anterior, give rise to the
right and left coronary
arteries, respectively.
Fig 23.9
Fig 23.10
Coronary Veins
• The venous system of the
cardiac circuit collects
blood that leaves the
capillaries of the
myocardium. Capillaries
are the vessels that
function as the sites of
vascular exchange.
Venous blood enters
three major veins, the (1)
great cardiac vein, the (2)
middle cardiac vein, and
the (3) small cardiac vein,
which merge into the
large coronary sinus.
Coronary Veins
Fig 23.11
Fig 23.12
Sheep Heart Dissection
Lab Activity 2
Sheep Heart Dissection
Lab Activity 2
Fig 23.14
Fig 23.15
Fig 23.13
3
Sheep Heart Dissection
Lab Activity 2
Fig 23.16
Fig 23.17
Lab Activity 3 – Frontal Section
Lab Activity 3 – Frontal Section
Fig 23.18
Dissection - Route of Blood Flow
This method independently opens the right and
the left sides of the heart.
Fig 23.19
Fig 23.20
Dissection of the Right Side of Heart
Fig 23.21
• Dissection of the Right Side of Heart
Dissection of the Right Side of Heart
• Photograph of the
sheep heart showing
the structure of the
pulmonary
(semilunar) valve.
The pulmonary valve
prevents the return of
blood to the right
ventricle.
Fig 23.24
Fig 23.22
Fig 23.23
4
Dissection of the Left Side of Heart
Fig 23.25
Fig 23.27
Lab Activity 5 -Valves of the Heart
Fig 23.29
Dissection of the Left Side of Heart
Fig 23.26
Fig 23.28
Lab Activity 6 –Ventricular Walls
Fig 23.30
Electrical Events of the Heat
ELECTRICAL EVENTS OF THE
HEART
• The electrical activity of the heart is
graphically recorded as an
electrocardiogram (or ECG , EKG).
• Non-electrical events such as heart
sounds are converted by transducers into
electrical signals and are graphically
recorded.
5
Electrocardiogram
• Electrocardiographs are
medical instruments
specifically designed to
record
electrocardiograms.
• The electrocardiogram
is a recording of the
electrical activity
produced by the heart
by the depolarization
and repolarization of its
excitable tissues
(nodes, conduction,
and contraction
tissues).
Conduction System of the Heart
• The electrical
activity of the heart
(intrinsic) is
generated and
transmitted through
its conduction
system and
myocardium
(muscle).
Fig 23.31
Fig 23.32
ECG Waves
ECG Waves
•
P wave
– The P wave, a small upward wave, is the first ECG wave of a cardiac cycle. The
P wave begins with the depolarization of the SA node and represents the
depolarization of the atrial myocardium.
•
QRS complex
– The QRS complex follows the P wave. It is composed of the Q, R, and S waves.
The Q wave is seen as the first downward deflection, the R wave as the following
large upward deflection, and the S wave as the next downward deflection. The
wave pattern represents the depolarization of the ventricular myocardium (and its
conduction pathway).
•
T wave
•
P-Q interval
•
Q-T interval
•
S-T segment
– The T wave follows the QRS complex. It is an upward deflection and represents
the repolarization of the ventricles.
Fig 23.33
– The P-Q interval is the time beginning with the depolarization of the SA node
(start of P wave) to the beginning of ventricular depolarization.
• A normal electrocardiogram shows three distinctive
waves:
– (1) the P wave,
– (2) the QRS complex (Q wave, R wave, and S wave), and
– (3) the T wave.
– The Q-T interval is the time from the beginning of ventricular depolarization
through ventricular repolarization.
– The S-T segment is the time when the ventricles are completely depolarized.
Relationships between ECG, Blood
Blow, and Heart Sounds.
ECG Waves
• 1 Heart is in diastole (period of
rest). From the previous
cardiac cycle, the ventricles
have just finished blood
ejection, and their pressure is
low. Venous return brings
blood into the atria and the
ventricles.
• 2 P wave shows atrial
depolarization, and the atrial
enter systole (contraction).
Atrial systole provides final
push of blood into ventricles.
• Correlation of the
ECG waves to
colored related areas
of the heart.
Fig 23.34
Fig 23.35
6
Relationships between ECG, Blood
Blow, and Heart Sounds.
•
•
Relationships between ECG, Blood Blow,
and Heart Sounds.
• 5 T wave shows repolarization
of ventricles and the ventricles
enter diastole (relaxation).
Ventricular pressure drops
lower than the pressure in the
exiting vessels, and the
semilunar valves close.
Closing of the semilunar
valves produces the second
heart sound, the dub.
• 6 Heart enters diastole and
blood continues to fill the atria Fig 23.35
and ventricles due to pressure
of venous return.
3 QRS shows depolarization of
ventricles and ventricles enter
systole (contraction). Ventricular
pressure begins to increase and
the AV valves close producing first
heart sound, the dub. Atria enter
diastole (relaxation), and they
begin to receive blood from
venous circulation.
4 Ventricular contraction continues
to increase pressure. For a short
time, the ventricles are in
isovolumetric contraction, as their
volume does not change until the
semilunar valves open. Opening
of semilunar valves occurs when
ventricular pressure is greater
than the pressure in the exiting
vessels, the pulmonary trunk and
aorta. Blood is ejected from the
ventricles.
Fig 23.35
Auscultation of Heart
•
Auscultation is the term used to describe
listening to sounds of the body, such as the
sounds of heart, respiratory sounds, and sounds
of the gastrointestinal tract.
• Auscultation of the heart is useful in detecting
abnormal valve sounds and leaks between the
right and left sides of the heart, or blood vessels.
• Because of valve location and chamber
resonance, the sound associated with the
closure of each valve of the heart is best
auscultated at a specific site on the anterior
chest wall.
CARDIAC MUSCLE
Auscultation of Heart
Cardiac Muscle
• Aortic semilunar valve
– The aortic semilunar valve can
best be heard at the second
intercostal space at the right
sternal margin.
• Pulmonary semilunar valve
– The pulmonary semilunar
valve can best be heard at the
second intercostal space at
the left sternal margin.
• Bicuspid (mitral) valve
– The bicuspid (mitral) valve can
best be heard at the fifth
intercostal space vertically in
line with the middle of the
clavicle.
Fig 23.36
• Tricuspid valve
– The tricuspid valve can best
be heard at the fifth intercostal
space at the right sternal
margin.
Fig 23.37
•
Cardiac fibers form the myocardium (heart
muscle). The rod-like fibers are short, striated, mostly
uninucleate (some are binucleate), and form chains
(as the individual fibers are joined end-to-end at
intercalated discs) that branch.
7
Cardiac Muscle
• The transverse tubules are short. Cardiac
muscle does not have terminal cisternae, Thus,
cardiac muscle does not form triads.
• Contraction is dependent upon the presence of
calcium ions. Calcium ions bond to troponin
resulting in exposure of actin (thin filaments).
Depolarization of the fiber triggers the release of
calcium ions from the sarcoplasmic reticulum.
However, muscle depolarization opens calcium
ion channels in the sarcolemma allowing a
greater influx of extracellular calcium ions than
supplied by the sarcoplasmic reticulum.
Contraction is terminated by the removal of
calcium ions back into the sarcoplasmic
reticulum and to the extracellular environment.
Cardiac Muscle
• Intercalated discs are unique to cardiac muscle. Gap
junctions allow the transmission of small ions and
function as a direct electrical connection. Desmosomes
are junctions that provide mechanical connections
between adjacent fibers. Thus, depolarization,
contraction, and the transmission of tension involve all of
the junctioned fibers in the myocardium.
• The heart houses a group of self-excitable fibers called
the heart’s “pacemaker,” or sinoatrial node (SA node).
The pacemaker cells undergo spontaneous
depolarization. However, the rate of their depolarization
is controlled by the autonomic nervous system.
Lab Activity 8 – Cardiac Muscle
Tissue
Fig 23.39
Fig 23.40
Cardiac Muscle Cells - Action
Potential
• The action potential of
cardiac muscle cells
begins when the
membrane potential
reaches threshold. The
action potential is divided
into three general
segments,
• (1) rapid depolarization,
• (2) slow depolarization,
and
• (3) repolarization.
Rapid Depolarization
Slow Depolarization
•
•
At threshold fast-sodium ion channels of the
sarcolemma (plasma membrane) open, and
sodium ions rapidly diffuse into the cell. The fastsodium ion channels remain open for only a few
milliseconds resulting in a rapid depolarization of
the sarcolemma to about 30 millivolts. The
depolarization spreads down the short T tubules
and results in the release of calcium ions from
the sarcoplasmic reticulum. Calcium ions bind to
troponin and contraction begins.
Fig 23.41
As a result of the depolarization initiated by fastsodium channels, slow-calcium ion channels of the
sarcolemma open. For an extended time of about 180
milliseconds calcium channels allow the diffusion of
calcium ions from the extracellular environment. The
relatively constant influx of calcium ions for this
extended time results in the membrane potential
remaining a relatively stable level, a plateau. The influx
of calcium ions results in additional release of calcium
from the sarcoplasmic reticulum. Increased tension
results as additional calcium ions bind additional
troponin, resulting in increased cross-bridge interaction.
8
Repolarization
•
Repolarization occurs upon the closure
of the slow-calcium ion channels and the
opening of potassium ion channels.
Calcium ions are pumped back into the
sarcoplasmic reticulum and the
extracellular environment. The outward
movement of potassium, and the decrease
in calcium ion concentration returns the
sarcolemma to its resting membrane
potential.
Cardiac Conduction Fibers
•
In addition to the contractile fibers of cardiac
tissue, fibers that function in the generation and
conduction of action potentials are located in the
heart.
• Specialized myocardial conduction fibers include
nodal and conduction fibers.
– Nodal fibers, such as found in the sinoatrial and
atrioventricular nodes are mostly concerned with the
generation of cardiac action potentials.
– Conduction pathways such as the atrioventricular
bundle (bundle of His), the bundle branches, and
Purkinje fibers, function to rapidly spread action
potentials throughout the contractile cells.
CARDIAC CONDUCTION
FIBERS
Lab Activity 9 - Purkinje Fibers
• Observe a
preparation labeled
“Purkinje Fibers.”
Purkinje fibers are
commonly found in
bundles just beneath
the endocardium.
Purkinje fibers are
modified myocardial
cells.
Fig 23.42
Fig 23.43
Cardiac Output
• Stroke volume
Cardiac Output
– Stroke volume is the volume of blood ejected by each ventricle
by a single cardiac cycle, or heart beat. Stroke volume is
calculated by subtracting end systolic volume from end diastolic
volume.
• End Diastolic Volume
Cardiac output is the volume of blood
ejected by each ventricle in one
minute. Cardiac output is calculated by
multiplying stroke volume by heart rate.
– The end diastolic volume is the volume of blood in each ventricle
at the end of its relaxation and filling phase, diastole. The end of
diastole is marked by the beginning of systole, or the contraction
phase.
• End Systolic Volume
– The end systolic volume is the volume of blood remaining in
each ventricle at the end of the contraction phase, systole.
9
Stroke Volume
• Stroke volume is the
volume of blood ejected
by each ventricle by a
single cardiac cycle.
• Stroke volume (SV) is
calculated by subtracting
the volume of blood
remaining in the ventricle
upon completion of its
contraction (end systolic
volume, ESV) from the
volume of blood in the
ventricle at the beginning
of its contraction (end
diastolic volume, EDV), or
SV = EDV - ESV.
Changes Affecting the End
Diastolic Volume
•
Volume changes to the end diastolic volume include
changes produced as a result of filling time and venous
return.
• Filling time
– Filling time is a function of heart rate. The slower the rate the
more time available for ventricular filling (results in a decrease of
EDV), the faster the rate the less time for ventricular filling
(results in an increase of EDV).
• Venous return
– Venous return is the amount of blood returning to the ventricles
from systemic circulation. Factors influencing venous return
include blood pressure, vascular resistance, skeletal muscle
pumping mechanism, heart rate, etc.
Fig 23.44
Changes Affecting the End Systolic
Volume
•
Three factors that influence the end
systolic volume are
– (1) preload,
– (2) contractility, and
– (3) afterload.
Preload
• Preload is the based upon the volume of blood entering
(loading) the ventricles.
• Filling of the ventricles stretches the myocardium, and at
the myofilament level results in an outward sliding of the
thin filaments along the thick filaments. In cardiac muscle
(as opposed to skeletal muscle), the outward movement
of the thin filaments results in a better alignment of the
cross-bridges resulting in increased force of contraction.
• This mechanism is called Starling’s Law of the Heart.
Increased force of contraction results in an increase of
stroke volume (within limits) as more blood is forced from
the ventricles.
Contractility
Contractility is the ability of the ventricles to
change force of contraction. Several factors that
influence contractility are
• (1) stimulation by the sympathetic division (flight
or fight response) of the ANS,
• (2) hormones (especially, epinephrine,
glucagon, and thyroxine), and
• (3) electrolyte balance (especially, involving
changes in potassium and calcium ions).
Afterload
•
Afterload is the tension the ventricles
must produce to open the aortic and
pulmonary valves. Afterload is a function
of the blood pressure in the exiting vessels
of the ventricles. The greater the pressure
in the exiting vessels, the greater the
tension (afterload) of the ventricles
required to open their valves. The primary
factor that influences afterload is
increased resistance of circulation.
10
Heart Rate
Heart rate is primarily controlled by the
autonomic nervous system (ANS).
• The parasympathetic division (the
cardioinhibitory center) decreases heart rate,
and the sympathetic division (the
cardioacceleratory center) increases heart rate.
• The parasympathetic and sympathetic centers
are located in the medulla oblongata.
Heart Rate
• The cardioinhibitory center is the dominate control
center.
• The cardioacceleratory center increases stimulation to
the heart when the body is subjected to factors such as
emotional and physical crises, and decreased blood
pressure.
• Other factors, such as hormone levels (especially,
epinephrine, glucagon, and thyroxine) and electrolyte
balance (especially, Na+, K+, and Ca++) also influence
heart rate. The normal range for the heart’s rate of beat
is between 60 - 100 beats per minute, with most people
averaging between 70 - 80 beats per minute (bpm).
• Bradycardia is defined as a slow heart rate, usually less
than 60 bpm.
• Tachycardia is defined as a fast heart rate, usually over
100 bpm.
11

