University of Colorado-Denver - Intelligent Ground Vehicle
advertisement
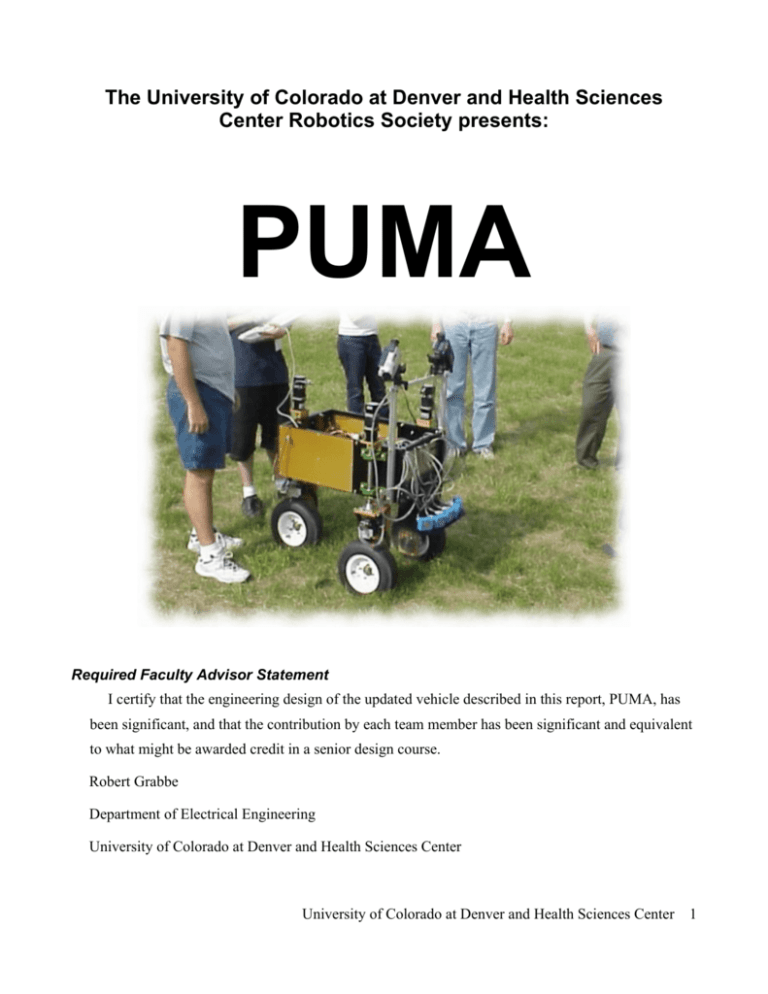
The University of Colorado at Denver and Health Sciences Center Robotics Society presents: PUMA Required Faculty Advisor Statement I certify that the engineering design of the updated vehicle described in this report, PUMA, has been significant, and that the contribution by each team member has been significant and equivalent to what might be awarded credit in a senior design course. Robert Grabbe Department of Electrical Engineering University of Colorado at Denver and Health Sciences Center University of Colorado at Denver and Health Sciences Center 1 Introduction The University of Colorado at Denver and Health Sciences Center (UCDHSC) is proud to return for the 14th annual Intelligent Ground Vehicle Competition (IGVC) with our autonomous ground vehicle Puma. This vehicle was entered in the 2004 IGVC, but due to catastrophic hardware and software failures was not able to qualify. Over the last two years we have made improvements to the vehicle which will allow it to perform much better this time. First and foremost, we have completely re-written the software used to control the vehicle. Our old software was a single, monolithic program which included all sensor and control interfaces and decision making code. Our new software uses a modular system in which individual pieces of code are developed independently of other the other pieces. This has allowed us to work much faster and with a much greater ability to collaborate. Several hardware changes have been made to the vehicle as well, including replacing our sonar array with SICK laser ranging units and improvements to the electrical systems. The sonars were replaced so that we could gain the greater accuracy and granularity of the laser units. Electrical system improvements were made to help improve our running time on one set of batteries. Design Process Our design process is based on the strategies laid out in the Hatley and Pirbhai book “Strategies for Real-Time Systems Specification” which is taught in several of our Electrical Engineering classes. Their strategies revolve around developing a requirements model for a system (what the system does) and an architecture model (how the system does it). This allows us to develop robust systems quickly and accurately and enables us to use a top-down development approach. While a complete description of the process and models is beyond the scope of this paper, we have included some of our models, along with brief explanations, to help illustrate how we developed our robot. Normally, data flows (solid lines) and control flows (dashed lines) are shown on separate diagrams but we show them here on a single diagram for brevity. Development Models University of Colorado at Denver and Health Sciences Center 2 Image Data Cameras Cameras SICK SICKLaser Laser Laser Range Data Steer Commands Control Robot Drive Commands E-Stop Status E-Stop Encoder Counts GPS Position Data SteeringMotors Motors Steering Steering Motors Drive Motors Motors Drive Drive Motors eTrex GPS Figure 1: Puma control system top level context diagram Figure 1 shows the combined Data Context and Control Context diagrams for Puma's control system. The context diagrams are the most simple representation of the system, showing a single process (Control Robot) along with it's data and control inputs and outputs. This allows you to get a quick idea of where data and control signals originate and in which direction they flow. Laser Range Data Pick Drive State Robot Location 1 Pick Path Image Data Line Location Find Line 4 Find Location Next State 3 GPS Position Data 2 Encoder Counts Velocity & Turn Angle Command Motors Drive Commands 5 Steer Commands E-Stop Status Figure 2: Puma control system DFD and CFD 0 Figure 2 shows the combined Data Flow and Control Flow diagrams at level 1 (directly below the context diagrams). This diagram is a drill-down into the “Control Robot” process of the context diagrams. One important thing to note is that flows which originate off this diagram (those which have an open connector) are the same as those entering and leaving the process this diagram describes. This University of Colorado at Denver and Health Sciences Center 3 is a strict requirement of the Hatley and Pirbhai design methodologies that helps ensure completed systems will work correctly. The E-Stop Status signal enters a control bar, because this control bar simply disables all of the processes we have left the control signals from this bar to all of the processes off of the diagram for simplicity. Image Data Laser Range Data Probability Density Functions Find Probabilities 1 Probabilities Cost Matrix Sum State Costs State Table State Costs 2 Choose Next State 3 Next State Figure 3: Puma control system DFD and CFD 1 Figure 3 shows the combined Data Flow and Control Flow diagrams at Level 2 for the process “Pick Drive State” from DFD and CFD 0 above. Again, the only control and data flow originating off the page are those specified entering or leaving the process above. Since the process being described is designated as process 1 on the level above this, this becomes DFD and CFD 1. If we were to drill down into the “Choose Next State” process on this diagram, it would be labeled DFD and CFD 1.3 since that process is designated as .3 on this diagram. This numbering scheme continues down to the lowest level of the model. The entities with lines above and below them are data stores used by the process. When a process can be easily described in English and does not require any sub-processes, a Process Specification (PSPEC) or Control Specification (CSPEC) is produced. The purpose of the PSPEC is to describe precisely how the outputs of a process are created from its inputs—usually as a mathematical equation or algorithm. The CSPEC is used to show how control signals are produced and the conditions under which they turn processes on and off. University of Colorado at Denver and Health Sciences Center 4 User Interface Operators & Judges Input Processing Camcorders SICK Lasers Control Commands Output Processing Video Signal Range Array GPS Location eTrex GPS Silvermax Motors E-Stop Puma Management System Steer & Drive Silvermax Motors Encoder Status Functional and Control Processing Figure 4: Puma management system ACD Combined, the Data and Control diagrams described above make up the requirements model. Along side the requirements model—and often developed simultaneously—is the architecture model. This model describes the physical systems used in the system and how they interconnect. This model is much more detailed and includes timing, electrical and hardware specifications. This is the model used to actually implement the system. Figure 4 shows the top level Architectural Context diagram for Puma's management system. Similar to the requirements model, there are Flow and Interconnect diagrams below this which specify the architecture for individual components and how they interconnect and interact. Using these design methodologies to design Puma, we have produced a robust and stable autonomous ground vehicle. These models have helped us to ensure that all requirements were met as we implemented the system and in some cases showed us that our initial ideas for implementation would not be able to handle the requirements. Hardware Puma's chassis consists of a main body, made of welded aluminum tubing and aluminum paneling, with three motor assemblies, sensors and electronics attached. This gives us a strong and rigid platform which is also relatively light. All of the fabrication was done in-house by students and school staff, and the final product was sent out for anodizing and powder coating for corrosion protection. University of Colorado at Denver and Health Sciences Center 5 Motor Assemblies Each motor assembly consists of a Quicksilver SilverMax S34N motor attached to an upright shaft through a 20:1 torque converter. This shaft attaches to the top of the drive motor assembly which consists of a Quicksilver SilverMax S23 motor attached to the drive wheel through a 17:1 torque converter. This system gives us plenty of torque for climbing hills and truly independent three wheel steering. Power for all of the motors is run through an automotive relay controlled by the E-Stop system. This allows us to cut power to the motors when an E-Stop is triggered without cutting power to the computer. Also, a hall-effect sensor attached to the rear wheel counts the teeth of the drive gear as they go by and triggers an E-Stop if the vehicle ever exceeds 5 miles per hour. Our goal originally was for the design to allow us to go 5 miles per hour, but subsequent testing has shown that we are actually limited to about 98% of that speed. Analysis of the system has shown us that the reason for this limitation is that we are supplying the drive motors only 36 volts and we would need 48 volts to achieve 5 miles per hour. Work is currently underway to produce a new power board that supplies 48 volts to the drive motors, but it does not look like it will be ready for this year's competition. Sensors & Electronics Inside the main body of Puma are all of the electronics and batteries used to run the vehicle. The body was designed to be spacious so that maintenance and other necessary functions could be performed easily. This has been a great feature for us as we find we are constantly tinkering with the vehicle during testing. For sensors, Puma uses SICK Laser ranging units, standard Sony camcorders and an eTrex Vista GPS receiver. The Laser units are attached to an adjustable shelf at the front of the vehicle which allows them to be close to the ground to help with detecting short obstacles. The cameras are mounted on an aluminum bar approximately two feet above the body of the vehicle. This extra height helps cut down on reflected glare from the grass as well as giving the cameras a wider field of view. The cameras are on adjustable mounts which allows for manipulating where the line is in the image when the vehicle is centered on the track. The GPS unit is attached to the top of the vehicle during waypoint runs to aid in determining the direction to each successive waypoint. The components inside Puma consist of a power board to distribute power to the motors and sensors, break-out modules for interfacing to the motors, batteries, an 8-port USB-Serial converter and the main computer which runs the control software. The power board was designed and built by a team University of Colorado at Denver and Health Sciences Center 6 of students as their senior-design project and the rest of the components are commercially available. Power for Puma comes from six 12V 7Ah sealed lead-acid gel-cell batteries. Three of these batteris are connected in series to supply 36V to the power board. The power board feeds the raw 36V directly to the drive motors and also passes it through 12V DC-DC converters to supply the sensor electronics and steering motors. Two more of the batteries are connected in series to supply 24V to the SICK Laser units and the sixth battery to supplies power to the computer system. This system allows us to run Puma for approximately 30 to 45 minutes on a single charge—plenty of time to complete a run in the competition. The computer which runs Puma's control code is a VIA EPIA MII motherboard with a Linux Media Labs LMLBT44 video capture card to interface the cameras. This system has a 1GHz processor, 512MB of memory and 15GB hard drive. It runs Gentoo Linux with a custom-configured kernel stripped down to the bare minimum needed to run the computer. We generally find that the processor is about 55% utilized when running the control code, allowing for growth should we add new sensors or change our control algorithms. Software Originally, Puma was controlled by a single monolithic application written by members of our group. We learned quickly that this design is both inefficient and impractical to develop as a team and after the 2004 competition began looking for an alternative. An obvious candidate to replace our monolithic program was National Instruments LabVIEW software—used by several of the other teams. While we were sure that LabVIEW would be capable of running Puma, our team has a strong commitment to open source software so we continued work on the monolithic program until we found the Player/Stage project. Using Player—and its companion program Gazebo—we have been able to rapidly develop a robust software control system which we feel is capable of competing well at IGVC. Player Player is a robotics server which acts as middle-ware for Control Client robotic control systems. Illustrated in Figure 5 is player's Player Server modular structure, it consists of three layers: drivers, the Player Findline Driver SICK Laser Driver server and clients. This allows for segregation of hardware- Camera Driver Findline Driver Camera SICK Laser interface code, data processing code and decision making code. Drivers are the bottom level of the system and come in two Figure 5: Player's modular structure University of Colorado at Denver and Health Sciences Center 7 flavors. Hardware drivers communicate directly with hardware and exchange data with sensors and actuators. These are the Camera driver and SICK Laser driver in Figure 5. Pseudo drivers perform dataprocessing on data from hardware drivers to turn it into useful information. In Figure 5, the Findline driver takes image data from the camera driver, looks for a line in the image, and returns information about the location of the line. The middle layer of the stack is the Player server itself. Player handles all passing of data between drivers and clients through a standard Application Programming Interface (API). This API defines interfaces for a multitude of sensors and actuators and is used by drivers and clients to either pass gathered data up—in the case of drivers—or pass commands down—in the case of clients. This API also allows for swapping of drivers which present the same interfaces to be swapped out without affecting the client's ability to retrieve data. For instance, should we ever decide to switch to FireWire cameras, we would only need to change the Camera driver to one that grabs data from FireWire cameras and the system would continue to work as it had before. This allows us great flexibility over the hardware we use on the system. The other advantage of the API is that it allows us to swap out real hardware with simulated hardware or recorded log files very easily. Gazebo—the 3-D simulator that runs with the Player server —allows us to build a model of Puma, put it into a virtual world similar to a competition run track and run unmodified control code to move the model within the world. This allows us to have a very short turnaround time testing within the simulator to testing on real hardware. Clients are the top level of the Player stack and they contain the actual decision making code. Data from sensors is analyzed by clients, decisions about movement are made, and commands are sent back to drivers which control actual hardware. This separation allows for easy testing of different control algorithms and simpler control programs. Puma Control with Player Puma is now completely controlled using Player. To get this working, we had to write two custom drivers—one to interface to the SilverMax motors and one to do line finding. Once these drivers were working, several clients were developed for competition and testing. Together, the whole system is much more robust and stable than the monolithic program originally developed. Also, due to the splitting up of code into individual projects, working as a team has become much more easy. University of Colorado at Denver and Health Sciences Center 8 Custom Drivers PumaBody: This is the motor interface driver. It takes speed and steering commands through the Player API, calculates the steering angle and speed for each motor using Ackermann steering geometry and sends commands to the SilverMax motors via serial connections. Each motor is connected through a separate serial port on the 8-port USB-Serial converter, which allows for all commands to be sent simultaneously and lowers delay in the system. FindLine: This is the line finding driver. As new images become available from the Camera drivers, FindLine takes a small strip from the leading edge of the image and attempts to find the line within it. First, it histograms the strip to determine the brightest pixels. It then breaks the image into 6 overlapping segments and finds which segment is brightest. Finally, it looks for pixels within the image which are brighter than the histogram threshold value and determines where they are in the image. Once this is completed, the driver returns a value for the location of the line and some statistical information gathered along the way. The statistical information is used by the client to determine how reliable the value for the line is. Custom Clients Several clients have been developed to run with Player. Each one has a unique function. Testing of clients using Gazebo as a simulator has allowed us to develop these clients quickly with only some tweaking needed when they are moved over to the real robot. Joystick: This is a simple client used to driver Puma around with a USB joystick. It allows for reducing maximum speed as you drive to make maneuvering in limited space situations easier. FindLineTest: This client uses the data from FindLine to follow a line and is used for tweaking the FindLine driver. One advantage of the Player structure is that simple clients like this one are easy to write. Using this client, we can eliminate the other sensors from the system and study how well line following works. BDT: This client is setup to navigate the Autonomous Vehicle Challenge and is the crown jewel of our control system. It was developed by a Computer Science senior-design team and uses Bayesian Decision Theory (BDT) to control Puma for competition runs. We are using BDT to control the state transitions of a classic state machine instead of Boolean algebra. There are several statistical properties associated with a state transition including the probability of transitioning from one state to the next. All incoming sensor data is run through a Probability Density Function (PDF) for each possible state transition. Then these results are all summed together to form an overall probability for each possible University of Colorado at Denver and Health Sciences Center 9 transition based on the current sensor data. These transition probabilities are then multiplied by the values stored in the Cost Matrix for each correct and incorrect choice, the least costly state transition is then made. This has the effect of allowing us to assign high risk to certain behaviors and allows us to “play it safe” when making state transition decisions. Using BDT we are able to easily integrate multiple sensors that all return data about the same parts of the world that may or may not be in agreement about the state of the world. For instance we are able to use forward facing cameras, laser ranging units and sonar to tell us whether there is an obstacle in front of us, these sensors may not all agree that there is something there—perhaps a pothole is only seen with the camera and not the range finders—using BDT we are able to easily add new sensors and have overlapping information returned from these sensors in a meaningful way. GPS: This is the client that we are going to use for the Navigation Challenge. This client is also setup to use BDT in order to navigate to the next way point while also avoiding any obstacles seen by the multiple sensor systems. Cost Estimate We have spent approximately 1700 man hours on the construction testing and programming of Puma. Table 1 shows the expenditures to construct the vehicle. Subsystem Cost Video $1,312 Laser Range Finders $4,440 Motherboard $317 GPS Unit $300 Power Distribution $253 Frame/Body $800 Motors $10,382 Support Equipment $3,500 Total System Cost $21,304 Table 1: Cost Estimate Conclusion PUMA will be ready to meet the challenges at the IGVC this summer, and the team is looking forward to another successful run. This project would not be possible without the help of Electrical University of Colorado at Denver and Health Sciences Center 10 Engineering, Mechanical Engineering and Computer Science and Engneering Senior Design students, the CU-Denver Robotics Society and its volunteers, CU-Denver Electrical Engineering instructors and faculty, and the ongoing support of Engineering Department Dean Renjeng Su. University of Colorado at Denver and Health Sciences Center 11
