Lab: Standing Waves on a String
advertisement
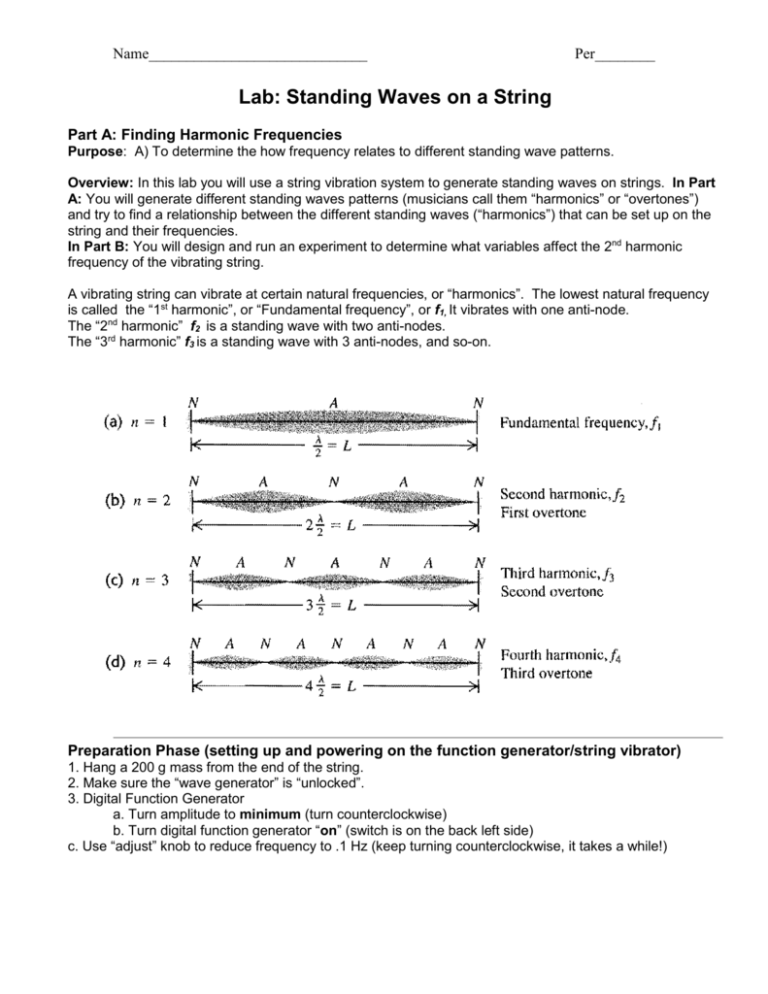
Name_____________________________ Per________ Lab: Standing Waves on a String Part A: Finding Harmonic Frequencies Purpose: A) To determine the how frequency relates to different standing wave patterns. Overview: In this lab you will use a string vibration system to generate standing waves on strings. In Part A: You will generate different standing waves patterns (musicians call them “harmonics” or “overtones”) and try to find a relationship between the different standing waves (“harmonics”) that can be set up on the string and their frequencies. In Part B: You will design and run an experiment to determine what variables affect the 2nd harmonic frequency of the vibrating string. A vibrating string can vibrate at certain natural frequencies, or “harmonics”. The lowest natural frequency is called the “1st harmonic”, or “Fundamental frequency”, or f1, It vibrates with one anti-node. The “2nd harmonic” f2 is a standing wave with two anti-nodes. The “3rd harmonic” f3 is a standing wave with 3 anti-nodes, and so-on. Preparation Phase (setting up and powering on the function generator/string vibrator) 1. Hang a 200 g mass from the end of the string. 2. Make sure the “wave generator” is “unlocked”. 3. Digital Function Generator a. Turn amplitude to minimum (turn counterclockwise) b. Turn digital function generator “on” (switch is on the back left side) c. Use “adjust” knob to reduce frequency to .1 Hz (keep turning counterclockwise, it takes a while!) Name_____________________________ Per________ PART A: Finding the Harmonic Frequencies HYPOTHESIS ABOUT HARMONIC FREQUENCIES: State your hypothesis about how the different harmonic frequencies f1, f2, f3, f4 are related mathematically. If you have difficulty stating a mathematical relationship, try to state a qualitative relationship between the harmonic numbers and their frequencies. As the number of standing waves (harmonic number) on the string increases, how is the frequency related? Read the instructions for using the string vibration equipment on the first page 1. 2. 3. 4. 5. Turn the AMPLITUDE knob all the way down to MIN to start Turn the Frequency ADJUST knob all the way down to around 1 Hz to start Now turn the AMPLITUDE knob to the half-way mark (white mark vertical) Slowly turn the Frequency ADJUST knob up until you see a wave pattern develop When you see a standing wave, adjust the frequency back-and-forth until you see the maximum standing wave. 6. Record your observations and sketch the waveform in the PART A Data Table 7. Repeat steps 2 through 6 as you raise the frequency. Complete the table. PART A: DATA TABLE HARMONIC NUMBER 1 2 3 4 5 #WAVE F LENGTHS on String FREQ (Hz) SKETCH OF STRING Name_____________________________ Per________ GRAPH of HARMONIC # VS. FREQUENCY On a separate sheet, draw a proper graph of the harmonic number vs. frequency, including slope. CONCLUSION Explain your findings and compare them to your hypothesis. What pattern do you observe between harmonics and their frequency? Show how it fits the mathematical relationship about harmonic frequencies (look in your notes and textbook for that relationship!) LAB REPORT for PART A : should include 1. Purpose 2. Hypothesis 3. Data table (with sketches for Part A) 4. Graph of harmonic number vs frequency 5. Conclusion explaining results LAB PARTNER________________________________ LAB PARTNER________________________________ LAB PARTNER________________________________ LAB PARTNER________________________________ LAB PARTNER________________________________ LAB PARTNER________________________________ LAB PARTNER________________________________ Name_____________________________ Per________ How do you play different notes on a guitar? PART B: Design an experiment to determine which variables affect the harmonic frequencies of a vibrating string OVERVIEW: Sometimes it is useful to be able to set a string vibration to a specific frequency, for example, a musician wants a guitar to play exact proper notes. There are several different ways to get a string to vibrate at a specific frequency, and you will choose 3 to investigate. Discuss with your group and choose 3 independent variables that you think might change the 2nd harmonic frequency of a standing wave. Select variables that can be tested with the materials and time available in the classroom. FIRST HYPOTHESIS : Write your hypothesis about how Variable A might affect the 2nd harmonic frequency of a vibrating string. ( for example, “The color of the string affects the frequency of a standing wave on a string. Darker colors strings have a higher harmonic frequency than lighter colors. This is because darker colors have more vibrational energy in them.”) SECOND HYPOTHESIS : Write your hypothesis about how Variable B might affect the 2nd harmonic frequency a vibrating string. THIRD HYPOTHESIS : Write your hypothesis about how Variable C might affect the 2nd harmonic frequency a vibrating string. Name_____________________________ Per________ DESIGN THE EXPERIMENT: - How are you going to change and test the independent variables you have chosen? - What data you want to record in order to test your hypothesis? - Create a data table before you start your experiment so you know what you need to measure. - What is independent variable? What is the dependent variable? - Make at least four different variations to the independent variable and test it. - SHOW YOUR HYPOTHESES AND DATA TABLE TO YOUR INSTRUCTOR. After he or she approves it, you may proceed with running your experiment. RUN THE EXPERIMENT AND RECORD YOUR DATA IN A TABLE Make sure you record every trial and the value of your variables and results. GRAPH YOUR DATA with Independent Variable on the horizontal axis and Dependent Variable on the vertical axis. Draw a best fit line. You should have separate graphs for each Independent Variable. WRITE YOUR CONCLUSION about your findings and how they compare to your hypothesis. Show how your results fit the mathematical expression for the 2nd harmonic frequency. LAB REPORT FOR PART B 1. Purpose 2. 3 Hypotheses 3. Complete Data Table for each independent variable 4. 3 Graphs of Dependent vs. Independent variables 5. Conclusion explaining results LAB PARTNER________________________________ LAB PARTNER________________________________ LAB PARTNER________________________________ LAB PARTNER________________________________ LAB PARTNER________________________________ LAB PARTNER________________________________ LAB PARTNER________________________________
