LAB on the Wine and Heart
advertisement
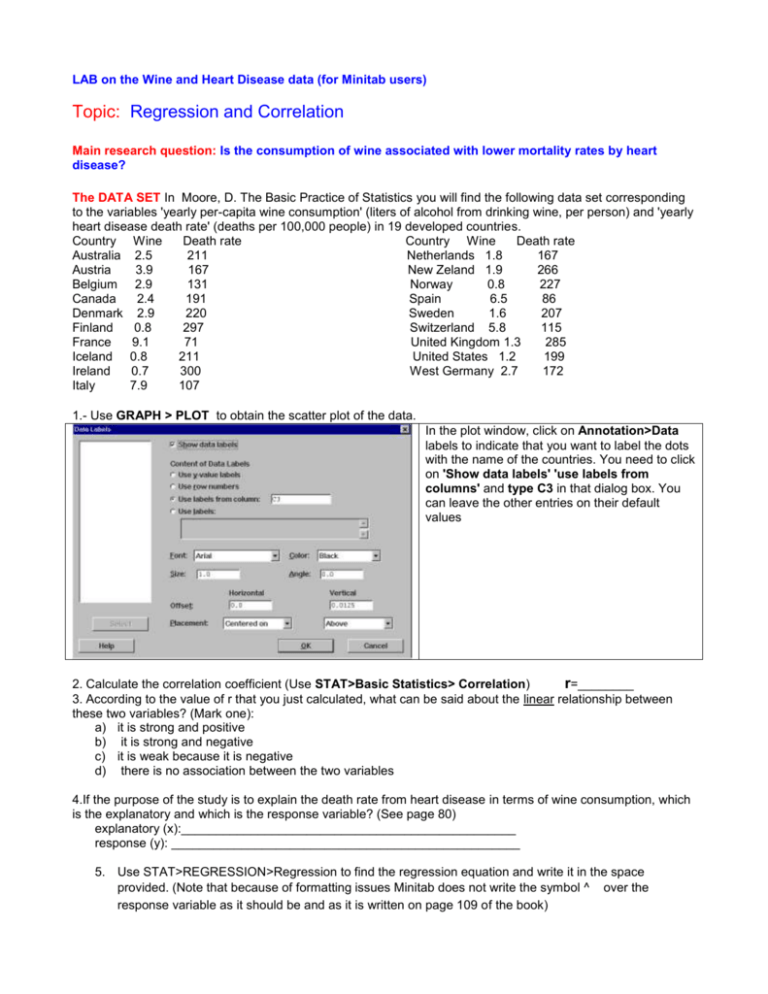
LAB on the Wine and Heart Disease data (for Minitab users) Topic: Regression and Correlation Main research question: Is the consumption of wine associated with lower mortality rates by heart disease? The DATA SET In Moore, D. The Basic Practice of Statistics you will find the following data set corresponding to the variables 'yearly per-capita wine consumption' (liters of alcohol from drinking wine, per person) and 'yearly heart disease death rate' (deaths per 100,000 people) in 19 developed countries. Country Wine Death rate Country Wine Death rate Australia 2.5 211 Netherlands 1.8 167 Austria 3.9 167 New Zeland 1.9 266 Belgium 2.9 131 Norway 0.8 227 Canada 2.4 191 Spain 6.5 86 Denmark 2.9 220 Sweden 1.6 207 Finland 0.8 297 Switzerland 5.8 115 France 9.1 71 United Kingdom 1.3 285 Iceland 0.8 211 United States 1.2 199 Ireland 0.7 300 West Germany 2.7 172 Italy 7.9 107 1.- Use GRAPH > PLOT to obtain the scatter plot of the data. In the plot window, click on Annotation>Data labels to indicate that you want to label the dots with the name of the countries. You need to click on 'Show data labels' 'use labels from columns' and type C3 in that dialog box. You can leave the other entries on their default values 2. Calculate the correlation coefficient (Use STAT>Basic Statistics> Correlation) r=________ 3. According to the value of r that you just calculated, what can be said about the linear relationship between these two variables? (Mark one): a) it is strong and positive b) it is strong and negative c) it is weak because it is negative d) there is no association between the two variables 4.If the purpose of the study is to explain the death rate from heart disease in terms of wine consumption, which is the explanatory and which is the response variable? (See page 80) explanatory (x):________________________________________________ response (y): __________________________________________________ 5. Use STAT>REGRESSION>Regression to find the regression equation and write it in the space provided. (Note that because of formatting issues Minitab does not write the symbol ^ over the response variable as it should be and as it is written on page 109 of the book) 6. Interpret the value of the slope for this specific example, please do not use generic terms as X or Y but refer to the variables we are dealing with in this example. (Hint: see the note for the slope on page 109) 7. Use STAT>Regression>Fitted regression line to plot the fitted regression line, do not include the names of the countries on your graph. 8. What would be the predicted heart disease death rate for a country for which the wine consumption is 1.2 liters per person? Show your work (do not use softwareb) and include the units in the answer. 9. Calculate the residual for the heart disease death rate for the USA Show your work (do not use software) 10.Now use Minitab to check your answer to questions 8 and 9 Use STAT>REGRESSION>Regression and click on the button for Results to get the following window at the right. Mark the last option, which asks for the full table of fits and residuals. Click OK. 10. What is the value of R2?______________ Provide a clear interpretation of that value for this specific example (don't talk in terms of generic variables x and y, but refer to the specific variables in this example.) 11.Can we say that there is a strong (linear) association between wine consumption and heart disease death rate? Yes No 12. Can we say that drinking wine causes a reduction in heart disease deaths? Yes No 13. Think of two possible lurking variables in this study. 14. Can France be considered an outlier in the regression context? Why? Yes No 15. Can we use this model to predict the heart disease death rate for a country for which the wine consumption is 12 liters per person? Yes No Explain why or why not: After you have answered all the questions, summarize your findings in a paragraph in plain English stating very clearly what you can say and what you can not say about the association (if any) between wine consumption and heart disease.

