18th European Symposium on Computer Aided Process Engineering – ESCAPE 18
Bertrand Braunschweig and Xavier Joulia (Editors)
© 2008 Elsevier B.V./Ltd. All rights reserved.
Uncertainty patterns and sensitivity analysis of an
indicator based process design framework
Stavros Papadokonstantakisa, Agarwal Siddhartaa, Hirokazu Sugiyamaa, Konrad
Hungerbühlera
a
Swiss Federal Institute of Zurich, Wolfgang Paulistr. 10, Zurich 8093, Switzerland
ABSTRACT
In recent years, many chemical companies have adopted the concept of sustainable
development as a core business value. With focus on early phases of process design for
continuous processes (Methyl Methacrylate process) this study tests the robustness of an
established design framework, which integrates monetary, environmental, health and
safety objectives. The framework comprises four stages of process modeling, each one
being characterized by the available information for reaction route, yield, reaction time
and separation scheme. Since several important factors are available in detail only at
later phases of process design, a variety of evaluation indicators is used, which are then
aggregated to a total score, realizing a multi-objective assessment. Although this is a
popular approach in chemical engineering, especially when the development of rigorous
models appears to be problematic or time consuming, the uncertainty issues arising
must be clearly identified and analyzed, in order for the decision-maker to be able to
evaluate correctly the value and limitations of the framework. The heuristical definition
of the evaluation indicators, the experience based and often process specific weighting
factors, the unknown nature of interactions between the aforementioned parameters, and
the relative ranking based on type of designs taken into account form the ensemble of
major uncertainty sources. The present study systematically detects the conditions under
which these uncertainties become important and focuses more on those cases that the
implementation of such a framework would fail to reach a statistically significant
conclusion. A variety of uncertainty patterns and sensitivity analysis methods were
applied for each defined stage and the proposed analysis is demonstrated on the design
of a Methyl Methacrylate continuous process, considering six different synthesis routes.
The crucial limitations identified in the results set the framework boundaries, assisting
in this way the decision-maker to evaluate its scope and importance.
Keywords: early phase process design, multi-objective assessment, heuristical
indicators, uncertainty patterns.
1. INTRODUCTION
Among several possible methods for such multi objective decision-making, e.g. spider
plots [1] or Principal Component Analysis (PCA) for comparing various Safety, Health
and Environmental aspects [2], the present study uses an aggregation approach, i.e.
Design stages
different indicator results are aggregated into a single evaluation score using weighting
factors [3].
Process
Chemistry I
(PCI)
Process
Chemistry II
(PCII)
Conceptual
Design I
(CDI)
Conceptual
Design II
(CDII)
Considered aspects
Reaction
Reaction
+ Separation
+ Waste treatment
+ Equipment
Model includes
Stoichiometry,
100% yield (ideal)
Conversion, selectivity,
auxiliary, catalyst,
solvent, byproduct,
heat of reaction
Shortcut process models,
simple property data
Rigorous process
models, non-ideality,
reaction kinetics,
detailed property data
Decision
structures
No decision forced
screen routes with
serious problems
Select some
reaction routes
D1
Raw material cost
Raw material cost
(theoretical minimum) (updated)
Supplemental
indicator
Multiobjective
evaluation indicators
Economic
performance
Proxy for
gate-to-gate costs
/environ. impacts
Select process
option(s) &/or route(s)
Optimize parameters
by multiobj. evaluation
by sensitivity analysis
of all feasible options
D2
D3
D4
Production cost
Net present value
Mass Loss Indices
(MLI)
Energy Loss Index
(ELI)
CED in raw material
production
(theoretical minimum)
CED in raw material
production
(updated)
Cradle-to-gate CED
Cradle-to-gate CED
(updated)
Hazard in
E/H/S
EHS method
(substance-level)
EHS method
(incl. reaction mass)
EHS method
(incl. process mass)
EHS method
(updated)
Technical
aspects
#Reaction steps;
Raw material
availability;
Patents;
Blacklist substances
Technical problems
(e.g. long-term
catalyst activity)
Process complexity
Equipment
specification
Life-cycle
environmental
impacts
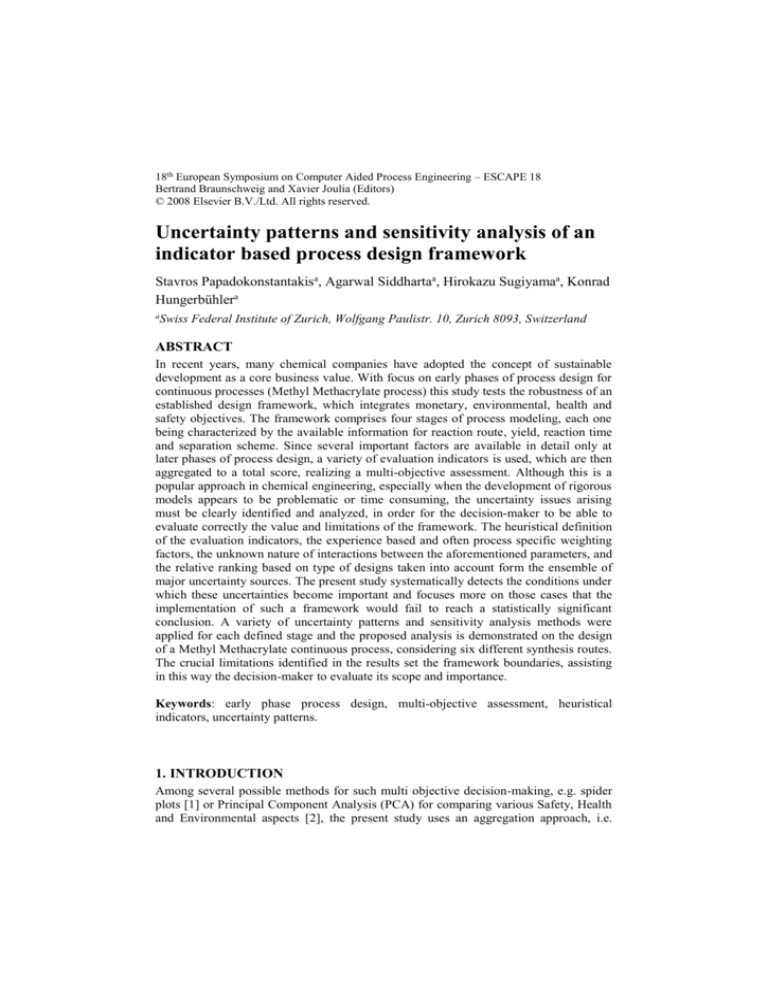
Figure 1: Overview of the framework: definition of design stages and appropriate modeling
approaches as well as evaluation indicators for each stage.
This process design framework includes four stages of process modelling and multiobjective decision-making. Focusing on early design phase, Process Chemistry I/II and
Conceptual Design I/II, are defined according to the available information as a basis for
process modelling and assessment. For each defined stage, appropriate modelling
methods and evaluation indicators regarding economy, life-cycle environmental
impacts, EHS hazard and technical aspects have been selected. Based on the evaluation
results, multi-objective decision-making is performed systematically at each stage
(Figure 1). This framework has been previously evaluated in a case study (Methyl
Methacrylate, MMA), where it was mimicked step-by-step with 6 synthesis routes as a
starting point. By comparing the evaluation profile of these six routes over different
stages, several factors were identified that are available in detail only at later stages, and
which cause significant updates to the results. An example of the aggregation procedure
in this framework is depicted in Figure 2.
X sr,i is the evaluation indicator of route r at
design stage s (i.e. from Process Chemistry II to Conceptual Design II ) in considered
r
r
r
r
r
r
category i, (i.e. Es , Ps , Ls , SH s , HH s , EH s ), the different elements being the
evaluation indicators for economy, proxy for gate-to-gate energy related economic and
environmental impacts, life-cycle environmental impacts, and hazards in safety, health
and environment, respectively. Before aggregation, the indicator values are normalized
by the maximum (i.e. the worst) indicator value of all routes in the respective category i,
as follows:
X sr,i
X sr,i
max( X sr,i )
r
Level 1:
Normalized scores
r
X PCII ,i
Raw mat. cost: E
Level 2:
Mid-point scores
Aggregation
step 1
r
M PCII
,j
w1,i
Level 3:
Total score
r
TPCII
Aggregation
step 2
w2 , j
x w1,RM-Cost(=0.77)
+
Cost
+
CED
x w2,Cost(=0.50)
x w1,ELI-Cost(=0.23)
Proxy by ELI: P
Raw mat. CED: L
Safety hazard: SH
Health hazard: HH
Env. hazard: EH
x w1,ELI-CED(=0.23)
x w2,CED(=0.20)
x w1,RM-CED(=0.77)
+
Total score
x w1,S(=0.40)
x w1,H(=0.20)
+
Hazard
x w2,Hazard(=0.30)
x w1,E(=0.40)
Figure 2: Aggregation scheme at Process Chemistry II. Values of weighting factors are those used
in the case study.
From the normalized scores at Level 1 three mid-point scores are calculated
(Aggregation Step 1 in Figure 2), in cost, overall cumulative energy demand (CED) and
hazard (Level 2). In aggregation step 1, weighting factors within cost category are based
on industrial statistics about the ratio of raw material and separation cost. The same
weighting factors are applied in CED category, for which such empirical values were
not available. The adopted values are from commodity industry and in other processes
weights can be different, e.g. in fine or specialty chemicals raw material costs are
typically higher. Within the hazard category, the indicated weighting factors are chosen
according to the respective number of sub-categories, i.e. 4 in safety, 2 in health and 4
in environment. In aggregation step 2 the mid-point scores (Level 2) are aggregated in
order to provide the final total score (Level 3). In this second aggregation step the
weighting factors reflect company’s culture to rank cost, CED and hazard.
2. UNCERTAINTY ISSUES AND SENSITIVIY ANALYSIS IN THE
FRAMEWORK
Despite the promising results after the framework implementation in a complex case
study, the assessment of the framework robustness should consider the uncertainties
involved in it. These could arise from subjective scaling and weighting of various
parameters in the definition of indicators, subjective weighting in the aggregation steps,
unknown significance level in differences of the indicator values, as well as limited
coverage of the field under consideration for each indicator Among these different
sources of uncertainty the present study focuses on the impact of uncertainty in the
indicator values and the weights aggregating them, in particular on the identification of
those regions where the selection between the best route and the rest becomes
statistically insignificant.
This problem was approached by examining the ratios of weighting factors which
represent the order of relative importance of an indicator or mid-point score over the
other. Each defined weight ratio was updated from each original value using a gradient
descent method to the direction of minimization of the total scores differences. At each
update step of this weight ratio the indicators values were also updated using the same
approach, and an uncertainty was incorporated in terms of sampling from a normal
distribution. Those regions were identified in which a statistical t-test was indicating
that the total score of the best route is not significantly different from the one of its
competing route. Following this approach a variety of scenarios was tested, regarding
the width of the distribution depicting the uncertainty effect, the combinations of weight
ratios and indicator values considered uncertain, the normalization effect based on the
worst considered route, and the correlations between the indicators.
3. RESULTS AND ANALYSIS
The aforementioned approach for detecting the impact of uncertainties in the regions of
specified weight and indicator values was implemented in the MMA case study. The
respective MMA data regarding routes chemistry and process information can be found
in open literature [4]. Some typical results are presented in Figure 3. For each step of the
outer loop of weight ratios update, an inner loop of indicators update is executed a
predefined number of times. For each route r the algorithm is updating the indicator X
according to the respective first-order partial derivative:
X(t) = X(t-1) - η (∆Total Score)/ X
where (∆Total Score) = Total Score route r – Total Score route best.
Figure 3: The effect of uncertainty in combinations of indicator values with a sequentially
forward selection.
At each step of the indicator update, the new value of the indicator is used as the mean
of a normal distribution with predefined width, which represents the imposed
uncertainty pattern. This results in a distribution of the total score for each route, which
is compared with the respective distribution of total score of the best route using a t-test
for means. In this way it can be identified which indicator is the “fastest” in affecting
the inference based on the total score, “fastest” meaning requiring the minimum
percentage change. In this procedure of indicators updating the value of the indicator for
the worst route is kept constnat in order not to change the normalization of the system.
Since the weight ratios remain constant for all routes, their updating step, which is also
calculated on the basis of the first-order partial derivative, is averaged using “sum of
digits” method, (i.e. since there are 6 routes considered, the weight ratio update based
on the second best route receives a weight of 5/15, the third best one 4/15 etc. and finaly
the weighted mean of all indicated updating steps determines the weight ratio update).
In Figure 3 x-axis represents the number of update steps taken to shift the weight ratios,
while y-axis represents the range of percentage change which is required in the indicator
values for the decision to become uncertain. The error bars indicate the range of
percentage change required for a statistically insignificant decision, while straight
horizontal lines refer to indicators whose uncertainty pattern has not influenced the
inference at all. For example, an uncertainty in indicator E between 10 and 15% (Figure
3, first graph) can cause a statistically insignificant decision for the selection of the best
route. The uncertainty in all other indicators, when taken alone, is not affecting the
descision-making. Once such a result has been reached, a sequentially forward selection
is performed, i.e couples of E, which is the most sensitive indicator when considered
alone, with other indicators are tested and when the most sensitive couple is identified,
it forms the base for considering triplets and so on. The results of this procedure are
depicted in the rest of the graphs of Figure 3, where it can be seen that the total score is
more sensitive to the couple E-HH and the triplet E-HH-L respectively.
4. CONCLUSIONS & OUTLOOK
Our analysis has quantified some expected trends but has also revealed some cases for
further analysis. The main study result is that the importance of uncertainty in indicators
seems to be greater than that of the weights. Therefore, further analysis needs to be
carried out to determine and if possible correct the primary source of uncertainty in
indicators which arises from their definition and data accuracy used in their calculation,
while uncertainty in weights is a matter of design.
REFERENCES
[1] J. Gupta, D. Edwards, 2003, A simple graphical method for measuring inherent safety, Journal
of Hazardous Materials, 104, 15-30.
[2] R. Srinivasan, N. Nhan, 2007, A statistical approach for evaluating inherent benigness of
chemical process in early design stages, Process Safety and Environmental Protection Official
journal of the European Federation of Chemical Engineering: Part B, Available Online.
[3] H. Sugiyama, U. Fischer, M. Hirao, K. Hungerbühler, 2006, A chemical process design
framework including different stages of environmental, healt and safety assessment,
Computers Aided Chemical Engineering, 21, Part 1, 1021-1026.
[4] H. Sugiyama, Decision-making framework for chemical process design, PhD Diss. ETH No.
17186.


