Updated 9/17/2009
Introduction to Data Acquisition &
Analysis
In all fields of engineering, data acquisition is a critical step in testing any
design or theory. It is important to understand the methods and limitations
of measurements in order to create experiments and cont rols which help
analyze the phenomena of the world. This lab will cover the basics of using
the ITLL’s LabStation setup, which can measure many physical phenomena,
to measure the force a mass exerts on a transducer.
Transducers are sensors that transform one type of energy (e.g., mechanical and thermal) into a
different form of energy (e.g., electrical). Many sensors in this lab convert energy from force,
pressure, displacement, and temperature into electrical signals. This electrical signal is often
analog (continuous) and must be converted into a digital signal that can be processed by your
computer. The digital representation of an analog signal offers several advantages: 1) a digital
signal can be stored in volatile (RAM) or permanent magnetic memory, 2) digital signals can be
reproduced error-free, and 3) digital signals can be imported into a computer for computation and
analysis. However, when digitizing a signal, the analog data between each digital sample (datum
point) is lost. The benefits and limitations of digital data acquisition are important to
understanding your measurement and will be further explored in this lab.
Data Acquisition Card (DAQ Card)
The device in the computer that reads the analog voltage and converts it to a digital signal is
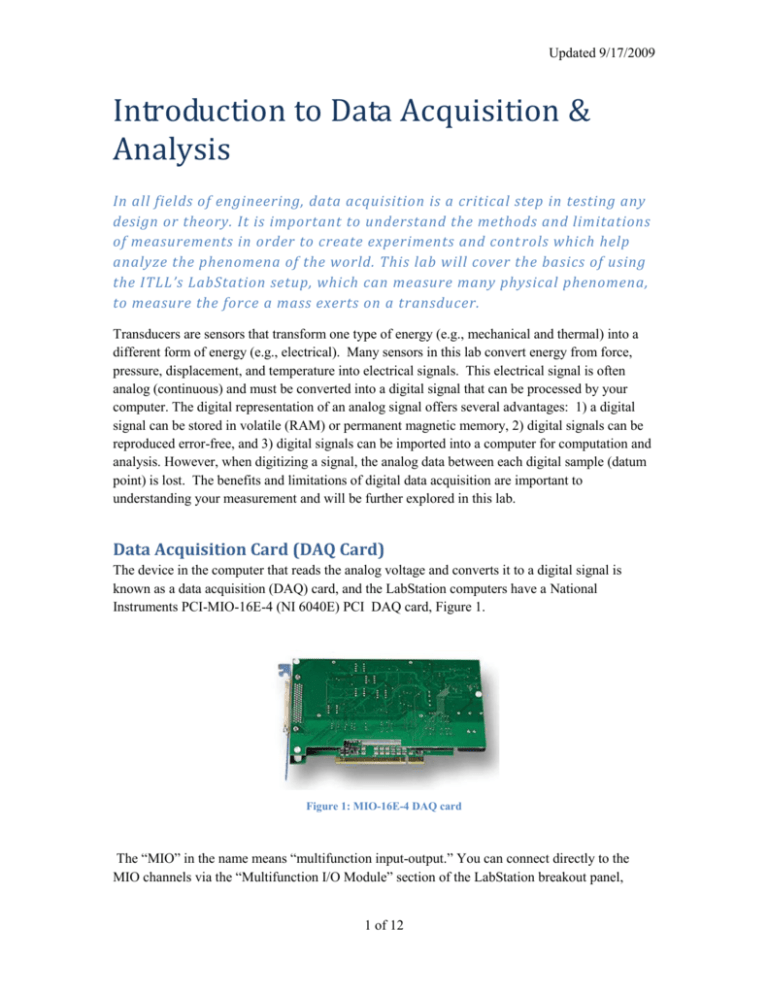
known as a data acquisition (DAQ) card, and the LabStation computers have a National
Instruments PCI-MIO-16E-4 (NI 6040E) PCI DAQ card, Figure 1.
Figure 1: MIO-16E-4 DAQ card
The “MIO” in the name means “multifunction input-output.” You can connect directly to the
MIO channels via the “Multifunction I/O Module” section of the LabStation breakout panel,
1 of 12
Updated 9/17/2009
shown in Figure 2. Also, the military connectors on the side of the LabStation can connect
directly to the DAQ card.
Figure 2: LabStation breakout panel (MIO connections).
Locate the channels as you read through their description. The multiple functions of the DAQ
card are described in the following sections.
Analog input
There are eight differential analog voltage inputs, but only seven are actually available for
measurement. The analog input ACH0 is used for communication with the SCXI chassis
(described later) and not generally available for measurement, but connections ACH 1-ACH 7
on the LabStation breakout panel are available for measurement usage (see Figure 2). An analog
input is simply an input port to the DAQ card specifically for continuous, analog signals. The
analog signal is then converted to a digital signal (digitized) by an analog-to-digital converter
(ADC or A/D Converter). The ADC for the LabStations digitizer has a 12-bit analog-to-digital
quantizer that quantifies an analog data sample into 1 of 4096 possible digital values, Figure 3.
The ADC can acquire data at a rate of up to 250 thousand Samples/s, and the LabStation software
can then take the acquired digital data, manipulate it, display it, and save it to a file.
2 of 12
Updated 9/17/2009
a)
b)
Figure 3. a) The typical components of an ADC; b) the comparison of an analog and a quantized signal
Analog output
There are two analog outputs, DAC 0 and DAC 1, on the LabStation panel (Figure 2). These
channels have a 12-bit digital-to-analog converter with update (output) rates up to 250 kHz. Note
that these outputs can only deliver 20 mA of current! If these outputs are used to control a motor
or some other power-hungry device, a power amplifier must be used! Otherwise, the DAC
outputs can be damaged.
Digital input/output
There are eight digital channels (DIO 0-DIO 7) that can be configured as input or output.
However, only channels 3, 5, 6 and 7 are available for student use because the others are used to
communicate with our SCXI data-acquisition modules describes later in the lab.
Counter/timers
Two counter/timers, inputs CTR0 and CTR1, can be used for event counting and timing. We use
event counting to find the frequency of a square wave signal. For example, an optical encoder
puts out a square wave whose frequency is proportional to its rotational velocity. Therefore, its
velocity can be measured with our counter. A timer is the opposite of a counter, in that we can
define an output frequency in software and the timer puts out the appropriate square wave.
3 of 12
Updated 9/17/2009
Reading a Signal using LabVIEW
LabVIEW is a powerful graphical programming tool. The program includes a well-designed
driver for interfacing with the DAQ card called NI-DAQmx. The power and simplicity of this
interface is a direct result of the fact that the hardware and LabVIEW software are both created
by National Instruments. Keep in mind that almost all instruments, including the HP, Agilent,
and Tektronix equipment on your LabStation, have LabVIEW drivers that are programmed in a
similar manner. A simple program to read a voltage signal will be created below.
Equipment
Function Generator
Oscilloscope
1 short BNC-BNC cable
1 long BNC-BNC cable
1 T-connector
Programming in LabVIEW Procedure
1. Open a blank VI in LabVIEW. LabVIEW programs are called VIs which stands for
Virtual Instrument. Notice two screens will appear. The gray screen, called the front
panel, is the interface that the end user will see. The white screen, called the block
diagram, is where the code is written.
2. Right click on your block diagram. Select the DAQ assistant,
Express>>Input and place it on the block diagram.
, under
3. On the screen that pops up, select Acquire Signals>>Analog Input and then Voltage.
Notice that measurement types can be acquired with the hardware and software available
on the LabStation.
4. The next screen is used to select the channels used in the measurement. We want to
acquire our signal directly from the DAQ card (not through one of the filter modules that
will be discussed later in the lab) so open PCI-MIO-16E-4 and select analog channel 1
(ai1). This corresponds to ACH 1 on the LabStation panel. Click finish.
5. Choose the following settings:
a. Under Settings and Signal Input Range, enter the voltage range expected. For
the purpose of this lab enter ±5 V.
b. Under Timing Settings and Acquisition Mode select N Samples. This makes the
VI takes a series of data points at a specified rate:
i. Enter the Samples to Read to 250. Sample to Read controls how many
samples the DAQ card sends to the computer with each function
execution.
4 of 12
Updated 9/17/2009
ii. Enter the Rate as 10,000 Hz. Rate controls how many samples are taken
per second. The overall execution time of the function, therefore, is
simply the number of samples to read divided by the sampling rate.
c. Press OK.
d. Any of these settings can be changed at any time by double clicking on the DAQ
Assistant.
6. Create a graph to display the data by right clicking on the arrow to the right of data on
the DAQ assistant and selecting Create>>Graph Indicator. On the front panel, a graph
should be present that will display the data.
e. Right click on the graph and select Visible Items>>Graph Palette. This tool,
Figure 4, is used to zoom in and out on the data in the graph.
Figure 4: The graph palette of a LabVIEW graph.
7. Create two controls, which are user input icons on the front panel, that change the sample
rate and number of samples on the front panel. Right click on the “rate” arrow on the
DAQ Assistant (hold the mouse over the arrow and the wiring tool
and name will
pop up). Select Create>>Control, and repeat this process for the “number of samples”
arrow on the DAQ Assistant. The program should now look like that shown in Figure 5.
Figure 5: The block diagram for a the first LabVIEW program.
8. Now use the function generator on top of the LabStation to produce a signal to read.
5 of 12
Updated 9/17/2009
a. Connect the T-connector to the function generator’s (FG’s) output. Then using
the BNC-BNC cables, connect the FG to channel 1 of the oscilloscope (O-scope)
so the signal can be monitored in real time. Turn both units ON.
b. Adjust the function generator to produce a 1 Vpp (Volt peak to peak), 100 Hz,
sine wave. Double check on the oscilloscope that the output signal is the right
voltage. If not, contact a TA for help.
c. Using a BNC cable, connect the other side of the T-connector to the DAQ card
by using the LabStation panel channel ACH 1.
9. Run the program by pushing the run button, , in the top left hand corner of the VI. A
time waveform should appear in the graph on the front panel. Save the program for later
use because this program is a simple LabVIEW tool to help understand measurement
error.
Uncertainty Analysis
Uncertainty analysis is important to make valid conclusions about data. We use uncertainty
analysis to estimate how well we know the absolute value of the item we are measuring. We are
usually concerned with both the single sample uncertainty, and with the statistics of multiple
measurements. Single-sample uncertainty is an estimate of the error in a single measurement.
We use statistics to characterize the variability of multiple measurements and to estimate the
statistical properties of the population that our measurements are sampling.
Below are a few key terms used in uncertainty analysis:
Single-Sample: A single measurement of some quantity.
Sample: Multiple measurements made of the same quantity, but of a lesser number than
the entire population.
Population: The entire set of possible values of the quantity being measured.
Single-Sample Uncertainty
Single-sample uncertainty estimates the effect of three types of error on the measurement:
resolution, systematic, and random. Keep in mind that single-sample uncertainty is an estimate of
the error in a single measurement. If we make multiple measurements then we can estimate the
statistical properties of the population, such as mean and standard deviation.
Resolution Error
Resolution is the smallest increments that a measurement system can measure. An easy example
would be a ruler as seen in Figure 6.
6 of 12
Updated 9/17/2009
Figure 6: A typical ruler with a 1mm resolution.
The smallest marked metric increment is 1mm; therefore, 1mm is the resolution of the ruler.
Granted, it is likely possible to tell if a measurement is approximately halfway between lines or
on the line, but resolution is defined as the distance between two successive quantization levels
which, in this case, are millimeter marks.
Question 1)
What is the resolution of the inch side of the ruler?
This same concept applies to any measurement, including the sine wave just acquired with the
above LabVIEW program. As previously mentioned, resolution is equivalent to the quantization
step size which is the distance between two successive quantization levels. There are two types
of resolution with which to be concerned in the sine wave just acquired with the DAQ equipment:
time resolution and amplitude (voltage) resolution.
Figure 7: An analog signal and digital representation of a 0.1 Hz sine wave (n=sample number).
7 of 12
Updated 9/17/2009
Time Resolution
Figure 7 shows a schematic drawing of the discrete representation of an analog signal, in this case
a 0.10 Hz sine wave. The time-varying, continuous, analog voltage is ‘sampled’ and converted
into discrete values as a function of the sample number and time between samples, y(nt). The
sample rate is defined as fs=1/t. The total length of time stored in memory is (N-1)t, where N
is the total number of samples collected. The total number of samples taken may be limited by
the memory of the instrument (up to 5 million samples for the Tektronix DPO 3012 oscilloscope),
or may be limited only by the available RAM of the computer used for data acquisition.
Time Resolution Procedure
1. Calculate the expected time period between samples and the total sample period for a 100
Hz, 1 Vpp sine wave, acquiring 250 samples at 10,000 samples/sec.
2. To show discrete data points on the VI graph, right click on the graph and go to
Properties>>Plots and select a marker. Click OK.
3. Run the VI for with the settings in Question 1. Record the total sampling period. Zoom
in, using the graph palette shown in Figure 4, until discrete data points are seen and find
the time interval between each point.
Question 2)
What is the total sampling period and time period between samples from
the VI graph? Do they agree with the calculated period and t? Show all calculations.
Nyquist Frequency
How well the digital signal represents the original analog signal depends on the sample rate and
number of samples taken. The faster the sample rate, the more closely the analog waveform may
be described with digital (discrete) data. If the sample rate is too low, errors may be experienced
and the nature of the waveform will be lost. Figure 8 shows what happens to the digital
representation of a 10 Hz sine wave when the sample rate is: (b) fs=100 samples/sec, (c) fs=27
samples/sec, (d) fs=12 samples/sec. As the sample rate decreases, the amount of information per
unit time describing the signal decreases. In Figure 8 (b) and (c), the 10 Hz frequency content of
the original signal can be discerned; however, at the slower rate, in (c), the representation of
amplitude is distorted. At an even lower sample frequency, as in (d), the apparent frequency of
the signal is highly distorted. This is called aliasing of the signal. In order to avoid aliasing, the
sample rate, fs, must be at least twice the maximum frequency component of the analog signal:
f s 2 f max .
The high frequency that can be correctly measured for a given sampling rate is known as the
Nyquist frequency and is half of the sampling rate.
8 of 12
(1)
Updated 9/17/2009
Figure 8: Effects of sample rate on digital signal amplitude and frequency.
Nyquist Frequency Procedure
In order to demonstrate the effects of aliasing, the same sine wave will be read at multiple sample
rates.
1. Make sure the function generator is still producing a 100 Hz, 1 Vpp sine wave.
2. Run your program acquiring 250 samples at 10,000 samples/sec.
3. Record the approximate apparent frequency and voltage on the VI. The easiest way to do
this is do zoom in on exactly one period and then calculate the frequency from the period.
4. Save a graph of the time waveform while zoomed in enough to see the cycles of the
signal. This can be done by right clicking on the graph of the front panel and selecting
Export Simplified Image… or by dragging a selection box around the graph and
selecting Edit>>Copy and pasting the image in a different file.
5. Repeat step 3 and 4 for the following sample rates: 500Hz, 200Hz and 150Hz.
Question 3)
What happens to the apparent frequency and voltage as the sample rate
decreased? What is the smallest sample rate possible that still reads an accurate
frequency? Include the pictures of the time waveforms from the above exercise when
answering these questions.
9 of 12
Updated 9/17/2009
Question 4)
What type of problems can aliasing cause?
Question 5)
Say five cycles of a 4 Vpp, 15-kHz sine wave need to be digitized. What is
the slowest sample rate that will capture the frequency of the signal? How many points
will be captured if all five cycles are digitized at this slowest sampling frequency?
Amplitude (Voltage) Resolution of the A/D Converter (DAQ Card)
As you probably already know, all information stored in a computer is stored in binary numbers.
For example, the number 168 is stored as 10101000. Each 1 or zero is referred to as a bit. The
entire 8 bit value is referred to as a byte. Due to the binary nature of computers, only certain
discrete values can be stored on a digital system.
The digital representation of the analog signal, shown in Figure 9, is discrete in amplitude as well
as time. The increment in time is the inverse of the sample rate; the increment in amplitude is the
amplitude resolution of the A/D converter. The voltage resolution of an A/D converter is given
by
Q
V fs
2n
(2)
where Vfs is the full-scale voltage range and n is the number of bits in the A/D converter. Typical
A/D converters have 8, 12, 16, or 24 bits, corresponding to a division of Vfs into 28=256,
212=4096, 216=65,536, or 224=16,777,216 increments. For example, an 8-bit converter with a -10
to +10 V range has a voltage resolution of 78 mV and a 16-bit converter with the same voltage
range has a resolution of 0.3 mV. In other words, any voltage value cannot be specified any more
precisely than the resolution of the A/D converter. Music CDs have a signal resolution that is of
a 16-bit A/D converter in order to achieve high sound quality. The DAQ card used in the
LabStations has a 12 bit converter.
10 of 12
Updated 9/17/2009
0.575
0.57
0.565
Voltage (V)
0.56
0.555
0.55
0.545
0.54
0.535
0.128
Figure 9: An analog signal (
0.13
0.132
0.134
Time (s)
0.136
0.138
) read with a 12 bit A/D with a ±5V Range in order to create a digital signal (-*).
Voltage Resolution Procedure
1. Calculate the voltage resolution of the DAQ with a full scale range of 10 volts.
(Remember that your voltage range you entered when setting up the DAQ was ±5V) The
DAQ system has 12-bit resolution, so all samples are represented by a binary number
between 0 and 212=4096.
2. To view the resolution in LabVIEW, you will need a voltage that varies slowly compared
to the sample rate, so decrease the function generator frequency and increase the
sample rate.
3. Run your program and then zoom in on a peak or a trough until you see the discrete
points. Vary the sample rate and/or signal frequency until you can see that several
samples appear to be at the same voltage level, with a jump to several samples at the next
level as in Figure 9. The voltage resolution of the DAQ is just the voltage difference
between points.
Question 6)
What was your measured voltage resolution of the DAQ when the full-scale
range is 10V? What is the expected voltage resolution of a 12-bit A/D converter with a
10V range?
Question 7)
How much memory (MB) is necessary to store 8 minutes of acoustic data
(mono) that is digitized at 10 ksamples/s with an 8-bit A/D converter? In stereo (2 data
vectors) at 44 ksamples/s with a 16 bit A/D converter? Note that a Megabyte is equal to
220 bytes (BE CAREFUL!).
11 of 12
Updated 9/17/2009
References
Navidi, Statistics for Engineers and Scientists, McGraw Hill 2006.
Holman, Experimental Methods for Engineers, 7th Edition, McGraw-Hill, New York, 2001,
A/D conversion, aliasing 14.5 p. 588.
Figliola and D.E. Beasley, Theory and Design for Mechanical Measurements, Wiley, New
Your, 1991, p. 225.
Wheeler, A.J. and Ganji, A.R., Introduction to Engineering Experimentation, Prentice-Hall,
1996, Chapters 4 and 5. (This is a short intro to A/D concepts)
Proakis, J.G. and Manolakis, D.G., Digital Signal Processing Principles, Algorithms, and
Applications, Pearson Prentice Hall, New Jersey, 2007.
12 of 12

