MACRO_SG_9e_chap_04
advertisement
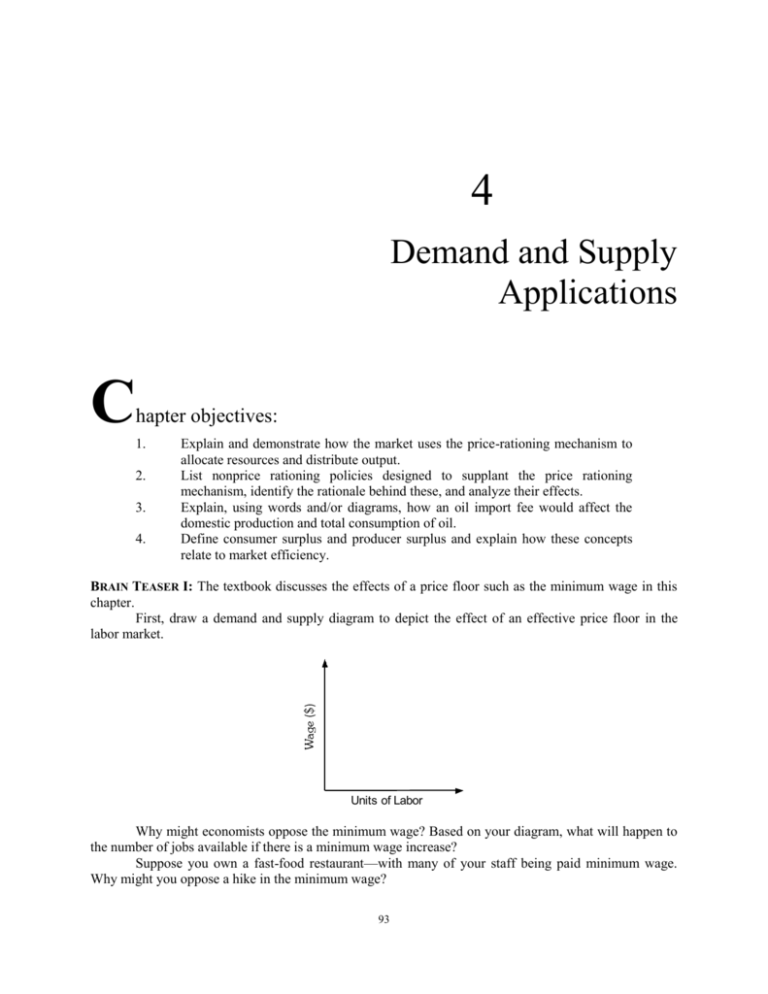
4 Demand and Supply Applications C hapter objectives: 1. 2. 3. 4. Explain and demonstrate how the market uses the price-rationing mechanism to allocate resources and distribute output. List nonprice rationing policies designed to supplant the price rationing mechanism, identify the rationale behind these, and analyze their effects. Explain, using words and/or diagrams, how an oil import fee would affect the domestic production and total consumption of oil. Define consumer surplus and producer surplus and explain how these concepts relate to market efficiency. BRAIN TEASER I: The textbook discusses the effects of a price floor such as the minimum wage in this chapter. First, draw a demand and supply diagram to depict the effect of an effective price floor in the labor market. Units of Labor Why might economists oppose the minimum wage? Based on your diagram, what will happen to the number of jobs available if there is a minimum wage increase? Suppose you own a fast-food restaurant—with many of your staff being paid minimum wage. Why might you oppose a hike in the minimum wage? 93 94 Study Guide to Principles of Macroeconomics BRAIN TEASER II: Over the years, the U.S. government has developed two distinct strategies regarding illegal drugs. One strategy (“the war on drugs”) has been to cooperate with the governments of countries where drugs are grown in order to destroy the supply at source. The other strategy (the “Just say no” campaign) has been aimed at discouraging drug consumption. Assume the two strategies have the same effect on the equilibrium quantity of drugs traded. Which strategy would you prefer, if you were a drug dealer? OBJECTIVE 1: Explain and demonstrate how the market uses the price-rationing mechanism to allocate resources and distribute output. The price system has two important functions—it allocates productive resources and rations scarce output. Because of scarcity, rationing always occurs. Price rationing distinguishes those who are “willing and able” to buy from those who are only able but no longer willing, i.e., it allocates according to the willingness and ability of consumers to pay—those who are willing and able to pay as the price increases will get the good. Demand is constrained by income and wealth but, within those limits, individual preferences will prevail. If demand increases, price rises, signaling producers that profits may be made. More of the good will be produced, with resources being switched from other lines of production. (page 73) LEARNING TIP: Note the lobster example in the textbook, which describes the allocative and rationing roles that prices play in the marketplace. Note, too, that the profit motive is highly durable. Limitations (such as price ceilings or rationing) placed on the operation of the market can lead to black markets so that demand can be serviced. PRACTICE: In fact, the Maine lobster market is changing. In recent years, catches of lobsters and the average size of the lobsters caught have been increasing. This may be due to global warming—lobsters may be moving away from the warmer waters in the south. What effect will this change have on the Maine market for lobsters? ANSWER: With larger catches, the supply of lobsters will shift to the right. More resources will be allocated to the lobster industry and the price of lobsters will decrease. Practice 1. In a market, either price must increase or nonprice rationing must occur when exists. (a) a shortage (b) a surplus (c) a horizontal demand curve (d) a vertical supply curve ANSWER: (a) Given a shortage, either price will increase (price rationing) or nonprice rationing must be enforced. 2. In a free market, the rationing mechanism is (a) price. (b) quantity. (c) demand. (d) supply. ANSWER: (a) Given an imbalance between quantity demanded and quantity supplied, a free market will adjust price to achieve equilibrium. Chapter 4: Demand and Supply Applications 95 Use the following diagram to answer the next five questions. Assume that the demand curve and the supply curve each must be in one the three possible positions shown. The initial market demand and market supply curves for Sam’s Supreme Submarine Sandwiches are D1 and S1. S2 S1 S3 $6 $5 $4 D2 0 D1 D3 100 200 300 400 500 Quantity 3. There is an increase in the cost of ingredients. If the price is held at the initial equilibrium level, there will be an excess (a) demand of 100 units. (b) demand of 200 units. (c) supply of 100 units. (d) supply of 200 units. ANSWER: (a) Supply has fallen to S2. Demand is unchanged. At a price of $5, quantity demanded is 300 units and quantity supplied is 200 units. 4. There is a simultaneous increase in demand and decrease in supply. At the initial equilibrium price, there will be an excess (a) demand of 200 units. (b) demand of 400 units. (c) supply of 200 units. (d) supply of 400 units. ANSWER: (a) Supply has decreased to S2. Demand has increased to D3. At a price of $5, quantity demanded is 400 units and quantity supplied is 200 units. 5. There is a simultaneous decrease in demand and decrease in supply. At the initial equilibrium price there will be (a) an excess demand of 200 units. (b) an excess demand of 100 units. (c) an excess supply of 200 units. (d) equilibrium. ANSWER: (d) Supply has decreased to S2. Demand has decreased to D2. At a price of $5, quantity demanded is 200 units and quantity supplied is 200 units. Equilibrium prevails. 96 Study Guide to Principles of Macroeconomics 6. Herman reduces the price of his Humongous Hoagie (a substitute for the Supreme Submarine). At the Supreme Submarine’s initial equilibrium price, there will be an excess (a) demand of 100 units. (b) demand of 200 units. (c) supply of 100 units. (d) supply of 200 units. ANSWER: (c) Demand has decreased to D2. Supply has not changed. At a price of $5, quantity demanded is 200 units and quantity supplied is 300 units. 7. Herman reduces the price of his Humongous Hoagie (a substitute for the Supreme Submarine). Following any shifts in the curves, we would expect a(n) in the Supreme Submarine market. (a) increase in quantity demanded and an increase in quantity supplied. (b) increase in quantity demanded and a decrease in quantity supplied. (c) decrease in quantity demanded and an increase in quantity supplied. (d) decrease in quantity demanded and a decrease in quantity supplied. ANSWER: (b) Demand has decreased to D2. Supply has not changed. There is an excess supply which will cause Sam’s price to fall. A fall in price will increase quantity demanded and decrease quantity supplied. OBJECTIVE 2: List nonprice rationing policies designed to supplant the price-rationing mechanism, identify the rationale behind these, and analyze their effects. Rationing by price may be considered “unfair”—poor people might be priced out of the market for some essentials—so other nonprice rationing methods, including queuing, ration coupons, favored customers, and lotteries, are applied. Such schemes usually involve hidden costs (queuing costs time, for example) that may make them inefficient. Note that different types of rationing benefit different groups of people. (page 75) At many colleges, basketball tickets are distributed on a first-come first-served basis—meaning that students must queue, perhaps for days, to get tickets to the big game. Not-so-hidden costs include the inconvenience, loss of study time, and possible health effects. As an example of a lottery, colleges may allocate dorm rooms, not by price or need, but by random number selection. LEARNING TIP: It may seem confusing to have a ceiling below the equilibrium price. Remember that a price ceiling stops the price going higher (just like a ceiling in a room), whereas a price floor is a lower limit. To have an effect on equilibrium price, a ceiling must be set below the equilibrium price and a floor must be set above the equilibrium price. A price ceiling sets a maximum price; a price floor sets a minimum price. The minimum wage is a price floor. An effective price ceiling creates a shortage; an effective price floor creates a surplus. A price ceiling need not be established below the equilibrium price, although a ceiling set above the equilibrium has no effect. Similarly, the imposition of a minimum wage of $2.00 per hour will have no effect on the labor market. Verify that this is true. If demand and/or supply conditions change however, a price ceiling or floor may become effective. For instance, adjustable rate mortgages have “caps” on how high the interest rate can move in response to market conditions—this is a price ceiling. Chapter 4: Demand and Supply Applications 97 ECONOMICS IN PRACTICE: There’s an old saying that “time is money”. Have you noticed how many of the textbook examples of “economics in practice” in this and previous chapters hinge on the trade-off between time and money? The same applies to the Shakespeare example in this chapter. Typically, those for whom time is less valuable are more inclined to queue to get lower prices. But what about situations where price is not explicitly involved? Duke University’s Cameron Indoor Stadium (at a pinch) can accommodate 11,000 spectators for basketball games. Students receive tickets for these popular games on a “first come, first served” basis. Students set up “Krzyzewskiville,” a tent village, in order to get tickets. Can you think of other similar examples where time and money are traded off? ANSWER: There are numerous examples. If you’ve ever clipped coupons or sent off for a rebate, used the services of a ticket scalper, or queued to sign up for a popular class, you’ve traveled beyond the conventional pricing system. ECONOMICS IN PRACTICE: In 2009, the minimum wage will increase to $7.25 per hour. Who gains and who loses from this wage? How do teenagers fit into your answer? ANSWER: There is a transfer of income from employers to minimum-wage employees with jobs. There is a reduction in the quantity of labor demanded—fewer workers are hired than would otherwise be the case. Workers who cannot find jobs (or who lose jobs) as a result of the wage floor are losers. The level of unemployment increases amongst the poor and unskilled—those least able to afford a reduction in job opportunities. Teenagers are amongst the least experienced workers, and evidence suggests that they suffer as a result of the minimum wage. Indeed, to redress the balance, an “opportunity wage” (a subminimum wage) was proposed for teenagers in the 1990s. Practice 8. A price ceiling is set below the equilibrium price. We can predict that (a) quantity demanded will decrease. (b) quantity supplied will be greater than quantity demanded. (c) demand will be less than supply. (d) quantity supplied will decrease. ANSWER: (d) Price will be reduced by the price ceiling. A decrease in price causes quantity supplied to decrease (not a shift in the supply curve). 9. A price ceiling is set below the equilibrium price. We can predict that (a) there will be a leftward shift in the demand curve. (b) there will be a leftward shift in the supply curve. (c) quantity demanded will be greater than quantity supplied. (d) quantity supplied will be reduced to equal quantity demanded. ANSWER: (c) A change in price does not cause the demand and/or supply curve to shift position! If price is “too low,” a shortage (quantity demanded greater than quantity supplied) will occur. 10. A price floor is set below the current equilibrium price. If supply increases, price would (a) increase. (b) decrease. (c) not change. (d) be indeterminate. ANSWER: (b) Initially, the price floor will have no effect. As supply increases, there will be a pressure for the market price to fall. If the price falls enough, then the price floor will become effective. 98 11. Study Guide to Principles of Macroeconomics Ticket scalping will be successful if (a) the demand curve is fairly steep. (b) the demand curve is fairly flat. (c) the official price is below the equilibrium price. (d) the official price is above the equilibrium price. ANSWER: (c) The slope of the demand curve is irrelevant in this case. The important issue is that a shortage of tickets exists because the official price has been set too low. OBJECTIVE 3: Explain, using words and/or diagrams, how an oil import fee would affect the domestic production and total consumption of oil. The text offers the imposition of a tax on imported oil (an oil import fee) as an example of the usefulness of demand and supply analysis. A new tax will raise the domestic price of oil, cutting quantity demanded and encouraging domestic production. The size of these changes depends on the slopes of the demand and supply curves or, more accurately, the responsiveness of demand and supply. Although the imposition of this tax would raise government revenues, reduce dependence on foreign oil, and stimulate domestic production of oil, inefficient domestic producers may be sheltered from lower-priced foreign competition. (page 80) Which consumers are most likely to be penalized by an oil import fee? Within the market, some buyers will have a demand that is relatively unresponsive to price changes, whereas others will be more able to trim demand if price rises. Would a price hike discriminate more against the poor (who may have little choice in their fuel consumption) than against those who are better off (who can afford to buy other kinds of heating)? Practice Refer to the following diagram for the next four questions. The world price of oil is $160 per barrel. World United States $ $ SUS 170 165 Price Price Sworld 160 160 DUS Dworld 0 0 Quantity (millions of barrels/day) 4 5 6 8 10 Quantity (millions of barrels/day) Chapter 4: Demand and Supply Applications 99 12. If the world price is the market price in the United States, then there will be a million barrels per day. (a) surplus of 10 (b) surplus of 6 (c) shortage of 10 (d) shortage of 6 ANSWER: (d) At $160 per barrel, quantity supplied is 4 million and quantity demanded is 10 million. 13. Suppose that the United States imposes a $5 per barrel import fee. This will result in each of the following EXCEPT (a) a decrease in imports to 3 million barrels per day. (b) an increase in the quantity supplied of oil in the United States to 5 million barrels per day. (c) a decrease in the quantity demanded of oil in the United States to 8 million barrels per day. (d) a decrease in United States imports of oil by 2 million barrels per day. ANSWER: (d) Oil imports had been 6 million barrels per day. After the imposition of the fee, oil imports are 3 million barrels per day. Imports decreased by 3 million barrels per day. 14. Suppose that the United States imposes a $5 per barrel import fee. This will generate a tax revenue of (a) $3 million per day. (b) $5 million per day. (c) $8 million per day. (d) $15 million per day. ANSWER: (d) Imports are 3 million barrels per day. Each barrel yields a tax revenue of $5. 15. Suppose that the United States wishes to become self-sufficient in oil. This could be done by (a) establishing a price ceiling (maximum price) of $15 per barrel of oil. (b) establishing a price ceiling (maximum price) of $30 per barrel of oil. (c) imposing a fee of $10 per barrel on foreign oil. (d) imposing a fee of $30 per barrel on foreign oil. ANSWER: (c) A fee of $10 per barrel on foreign oil will result in equilibrium in the U.S. market. OBJECTIVE 4: Define consumer surplus and producer surplus and explain how these concepts relate to market efficiency. For the final unit of a good purchased, the price should equal the value derived by the purchaser. Previous units should be valued more highly, but the same price charged. Consumer surplus is the difference between the value the purchaser places on purchases of a product and the price paid. Graphically, the consumer surplus is the area bounded by the demand curve, the vertical axis, and the product price. Changes in the size of the area reflect changes in consumer well-being. Can you see that, if the consumer’s demand for steak increases, ceteris paribus, then the consumer surplus will increase if price is unchanged? (page 81) 100 Study Guide to Principles of Macroeconomics LEARNING TIP: Put simply, consumer surplus is “the difference between the price you do pay and the price you would pay.” If you win an eBay auction at a lower price than you would have paid, the difference is your consumer surplus. Producer surplus is a similar concept but from the point of view of the seller. The difference between the market price and the lowest price a seller would accept is the producer surplus. If you auction a CD on eBay and would take $5 for it but you end up selling it for $12, your producer surplus is $7. (page 82) LEARNING TIP: Graphically, consumer surplus is the triangular area between the demand curve and the market price; producer surplus is the triangular area between the supply curve and the market price. By driving buyers and sellers to the intersection of demand and supply, market forces maximize the total surplus derived by participants. Any action that moves production away from the equilibrium level will reduce society’s surplus and will result in a deadweight loss to society. (page 83) Practice 16. Given your demand curve for bananas, as the price of bananas decreases, your consumer surplus will (a) increase, because the gap between the price you would pay and the price you do pay is greater than before. (b) decrease, because marginal utility diminishes as more of a good is bought. (c) remain constant, because the demand curve has not changed position. (d) remain constant, because the maximum price you would pay has not changed. ANSWER: (a) Refer to the definition of consumer surplus on p. 82. Use the following diagram to answer the following question. $ 14 10 D 0 200 700 Movies 17. When the price of a movie is $10, the consumer surplus is (a) $4. (b) $200. (c) $400. (d) $800. [Hint: the area of a triangle is 1/2(base height).] ANSWER: (c) Consumer surplus is the area between the demand curve and the price. With a straight-line demand curve it is 1/2(Pmax – P) Qd. In this case, consumer surplus is 1/2($14 – $10)200, or $400. Chapter 4: Demand and Supply Applications 18. 101 The market for baseballs is in equilibrium. Now there is a decrease in the supply of baseball. Assuming normally sloped curves, consumer surplus will and producer surplus will . (a) increase; increase (b) increase; decrease (c) decrease; increase (d) decrease; decrease ANSWER: (d) As the supply curve shifts to the left the area above the supply curve and below the demand curve becomes smaller. BRAIN TEASER I SOLUTION: S Wmin W* D 0 Q1 Q* Q2 Units of labor The minimum wage is an effective price floor. Both price floors and price ceilings restrict the free operation of the market. With an effective price floor, quantity supplied of labor will exceed quantity demanded, creating a surplus of job seekers—unemployment. There may be job loss, too, resulting in lower production. With rising labor costs, the economy’s ability to compete with low-wage foreign imports is reduced, although this is not a strong argument—minimum wage earners (only about 5% of the labor force) tend to cluster in service industries, and services are not exported or imported. As the owner of a fast-food restaurant, your bottom line will be hurt. Workers earning above the minimum wage (perhaps with more experience) would expect wage increases (the “ripple effect”). Small businesses on thin profit margins might have to trim back on employment by firing or by reducing hours. Alternatively, prices might have to rise, again reducing business. BRAIN TEASER II SOLUTION: The first (“the war on drugs”) strategy reduces supply and will increase the price. The second (“Just say no”) strategy reduces demand and will decrease the price. As a dealer, you should prefer the first strategy because the price you can charge, and the revenue you can earn, would be greater. 102 Study Guide to Principles of Macroeconomics PRACTICE TEST I. MULTIPLE-CHOICE QUESTIONS Select the option that provides the single best answer. 1. The government has decided that the free market price for baby formula is “too high.” Which of the following rationing proposals will result in the least misallocation of baby formula resources? (a) Proposal A: establish an official price ceiling, then let sellers decide how to allocate baby formula among customers. (b) Proposal B: issue coupons for baby formula that cannot be resold. (c) Proposal C: issue coupons for baby formula that can be resold. (d) Proposal D: establish a price ceiling and require purchasers to queue. 2. A government-imposed ceiling on apartment rents, if set above the equilibrium rent level, would (a) have no effect on the housing market. (b) lead to a persistent shortage of apartments. (c) lead to a persistent surplus of apartments. (d) shift the supply curve for apartments to the right. 3. A ticket to a concert by the Skreeming Habdabs costs you $35. However, your roommate offers you the “scalping” rate of $100 for your ticket. Your opportunity cost of refusing the offer and attending the concert is (a) $35. (b) $65. (c) $100. (d) $135. 4. Joe would pay $2.00 for his first cup of soda during the NCAA basketball championship game. He would pay $1.20 for his second, $1.00 for his third, and 80¢ for his fourth. If the price is (a) $1.00 per cup, Joe will buy 3 cups and have a consumer surplus of $4.20. (b) $1.00 per cup, Joe will buy 3 cups and have a consumer surplus of $3.20. (c) $1.10 per cup, Joe will buy 2 cups and have a consumer surplus of $1.00. (d) $1.10 per cup, Joe will buy 2 cups and have a consumer surplus of $2.10. 5. The market demand curve for pizza is given by Qd = 400 – 25P where P is the price of pizza in dollars. If the price of pizza is $10, the consumer surplus is (a) $150. (b) $225. (c) $450. (d) $800. [Hint: the area of a triangle is 1/2(base height).] Chapter 4: Demand and Supply Applications 103 Use the following graph to answer the next question. $ 4.00 J K 3.00 S L 2.00 M 1.00 D 0 6. 10 20 30 40 Quantity 50 Q Suppose a price ceiling of $1.00 is set. This will cause a (a) surplus of 50 units. (b) shortage of 50 units. (c) shortage of 30 units. (d) surplus of 30 units. Use the following diagram showing the oil market in the United States to answer the next two questions. The world price for gasoline is $4.50 per gallon. The equilibrium price in the U.S. market is $5.50 per gallon. Units on the horizontal axis are millions of gallons. $ S Price 5.50 5.00 4.50 D 0 40 7. 50 60 80 100 Q Quantity Assume that the United States neither imports nor exports gasoline. At the world price for gasoline, there is a of gas in the United States market of units. (a) surplus; 60 (b) surplus; 100 (c) shortage; 60 (d) shortage; 100 104 Study Guide to Principles of Macroeconomics 8. The government imposes an import tax that raises the domestic price of gas to $5.00 per gallon. If, because of discoveries of new oilfields, the domestic supply of gas increases by 30 million gallons per day (a) the domestic shortage of gas would be eliminated. (b) government tax revenues would be 30 million times 50¢. (c) quantity demanded would increase. (d) the equilibrium price would remain at $5.50. 9. In a market economy the rationing mechanism operates through adjustments in (a) price (b) quantity (c) expectations (d) queuing 10. Jill’s consumer surplus for Good A will (a) increase if the price of A increases. (b) increase if the price of B, a substitute for A, decreases. (c) decrease if Jill’s income decreases and A is a normal good. (d) decrease if the price of C, a complement for A, decreases. 11. The supply curve of bottled water on an island is completely vertical. The market for bottled water is in equilibrium. A ferryload of thirsty holidaymakers arrives and the demand for bottled water increases. Which of the following statements is true? (a) Price will serve as a rationing device. (b) Price will not serve as a rationing device because the quantity supplied cannot change. (c) Price will not serve as a rationing device because the equilibrium quantity demanded cannot change. (d) Price will not serve as a rationing device because neither the equilibrium quantity demanded nor the equilibrium quantity supplied can change. 12. A price ceiling is set above current equilibrium price. If supply decreases, price would (a) increase. (b) decrease. (c) not change. (d) be indeterminate. Use the following graph to answer the next three questions. Suppose a price ceiling of $1.00 is set in this market. $4 S $3 $2 $1 D 0 10 20 30 40 Quantity 50 Chapter 4: Demand and Supply Applications 105 13. The price ceiling will cause a (a) surplus of 50 units. (b) shortage of 50 units. (c) shortage of 30 units. (d) surplus of 30 units. 14. If the price ceiling is left in place, we would predict that, eventually, (a) demand would decrease until quantity demanded and quantity supplied were equal at a price of $1. (b) supply would increase until quantity demanded and quantity supplied were equal at a price of $1. (c) the market participants will be convinced that $1 is the equilibrium price. (d) a persistent excess demand would lead to the emergence of nonprice rationing practices such as queuing. 15. Relative to equilibrium, what is the value of the deadweight loss if the price ceiling is left in place? (a) $30 (b) $40 (c) $45 (d) $60 [Hint: the area of a triangle is 1/2(base height).] 16. An effective minimum wage is imposed. In the market for unskilled labor we would expect (a) a surplus and an increase in employment. (b) a surplus and a decrease in employment. (c) a shortage and an increase in employment. (d) a shortage and a decrease in employment. Use the following diagram to answer the next five questions. P P* 0 S A J B K C L 20 Q* D Q Quantity 17. When the market is in equilibrium, area(s) (a) J and K (b) A and B (c) A and J (d) B and K represent consumer surplus. 106 Study Guide to Principles of Macroeconomics 18. When the market is in equilibrium, area(s) (a) J and K (b) A and B (c) A and J (d) B and K represent producer surplus. 19. When the market is in equilibrium, area(s) (a) J and K (b) C and L (c) J, K and L (d) None of the above. represent deadweight loss. 20. If output is restricted to 20 units, area(s) represents producer surplus. (a) B and K; A and J (b) A and J; B and K (c) B; A (d) A; B represent consumer surplus and area(s) 21. If output is restricted to 20 units, area(s) (a) J and K (b) C and L (c) J, K and L (d) A, B and C represent the deadweight loss. II. APPLICATION QUESTIONS 1. Consider the following diagram, which shows the market for fluid milk. Quantity is in thousands of gallons. $ S $8.00 $4.00 $2.00 D 0 150 400 600 Quantity (Gallons of milk, thousand) (a) (b) (c) (d) Calculate total income for dairy farmers. Suppose that this income level is felt to be inadequate and that a political decision is made to boost farm income to $3,600,000. The government establishes a price floor at $6.00, with the government buying the surplus. How much milk will be supplied? Who gets the milk? The plan achieves the income objective, but what else has it done? There are costs involved with tampering with the price mechanism. What are they? Chapter 4: Demand and Supply Applications 107 Now suppose the government establishes a price ceiling of $2.00 per gallon. (e) How much milk do consumers actually receive? (f) Which plan is better for a milk consumer who pays no state tax? Why? (g) Calculate the deadweight loss if a price ceiling of $2.00 is imposed. 2. In Application Question 5 of Chapter 3, we examined the market for DVDs where the supply and demand curves are given by Qs = 3P and Qd = 60 – 2P, respectively. Refer to the following diagram. $ 30 S 12 D 0 (a) (b) (c) 36 Quantity 60 If the government imposes a price ceiling of $5 in this market, what will happen to the positions of the demand and supply curves? Calculate the consumer surplus at the equilibrium price. Calculate the producer surplus at the equilibrium price. Now suppose that a $6 per unit maximum price is imposed in this market. The diagram shows the impact on quantity demanded and quantity supplied. (d) Calculate the consumer surplus. (Careful!) (e) Calculate the producer surplus. (f) Calculate the deadweight loss. 3. In many Eastern European cities, there is a thriving market in farm produce. (a) Draw a demand and supply diagram below for the Warsaw egg market. Label the curves D1 and S1 respectively. Show the equilibrium price (P1) and quantity (Q1). (b) (c) In August, the price of eggs triples because of a decrease in supply caused by very hot weather. Show how the market changed in August. Label the new supply curve S2. Show the new equilibrium price (P2) and quantity (Q2). Is the Warsaw egg market operating efficiently? 108 Study Guide to Principles of Macroeconomics (d) (e) (f) (g) Suppose the government decided to maintain the initial price (P1). Should it impose a price ceiling or a price floor? Explain whether an excess demand or an excess supply will result. Is the Warsaw egg market now operating efficiently? How do you think suppliers might react to the price ceiling? Which nonprice methods might develop to circumvent the imbalance in this market? 4. A freeze destroys much of the South American coffee crop. This causes an increase in the price of tea. Explain why, using supply and demand diagrams. 5. Use the following demand and supply schedule to answer the questions. Price $6 $5 $4 $3 $2 $1 (a) (b) Quantity Demanded 10 20 30 40 50 60 Quantity Supplied 70 60 50 40 30 20 Calculate the equilibrium price and the equilibrium quantity. Now the government establishes a price ceiling of $2. Will this cause an excess supply or an excess demand? An excess of how many units? 6. Several members of a college faculty were standing in a rather long line at the campus cafeteria. One was heard to remark that she wished the cafeteria would increase prices. Can you explain why? 7. Who gained and who lost from government intervention in the market in the following case? In 1993, Congress scrapped subsidies for honey producers. Until 1988, a price floor was in place, with the government purchasing surpluses of honey. From 1980 to 1988, $525 million was spent on the program. 8. The auction site, eBay, offers an opportunity to observe consumer surplus and the demand curve. Choose an auction where many bidders have participated. Presumably, each bidder has bid up to the maximum value he or she places on the good for sale. These maximum bids (with the exception of the winner’s) are revealed after the auction ends. Can you construct the demand curve for your chosen auction? Suppose the actual price was lower than the winning price— determine the extent of the consumer surplus. PRACTICE TEST SOLUTIONS I. Solutions to Multiple-Choice Questions 1. (c) Issuing coupons that can be resold will lead to a market for coupons with those willing and able to pay the most receiving the right to buy baby formula. 2. (a) To be effective, a price ceiling must be set below the equilibrium price. Chapter 4: Demand and Supply Applications 109 3. (c) The opportunity cost is the value of the next best alternative given up, i.e., in monetary terms, whatever the $100 offered price would buy. The $35 has already been spent—it is a sunk cost. 4. (c) Consumer surplus is the difference between the price and the demand curve. Joe would buy two sodas because the value of the third and subsequent sodas is less than the price. His consumer surplus is ($2.00 – $1.10) + ($1.20 – $1.10). 5. (b) Given Qd = 400 –25P, the maximum value for P is $16 (i.e., 400/25). When P = $10, Qd = 150. Consumer surplus is 1/2(Pmax – P)Qd. so 1/2($16 – $10)150 = $450. Refer to p. 82. 6. (c) An effective price ceiling (set below the equilibrium price) will create a shortage. Quantity demanded is 40, but quantity supplied is only 10. 7. (c) The price is below the equilibrium price, with quantity demanded being 100 and quantity supplied being only 40. A shortage of 60 exists. 8. (a) The increase in supply would eliminate the shortage and eliminate government tax revenues. Recall that an “increase in supply” will shift the position of the supply curve to the right. 9. (a) When there is a market imbalance, price adjusts to allocate production. 10. (c) A decrease in income will reduce the demand for a normal good and, given the market price, consumer surplus will decrease. 11. (a) Demand has increased causing an excess demand. Price will rise to remove the imbalance. 12. (a) A price ceiling above the equilibrium price will have no effect. A decrease in supply, therefore, will result in a higher price. 13. (c) An effective price ceiling (set below the equilibrium price) will create a shortage. Quantity demanded is 40, but quantity supplied is only 10, so a shortage of 30 exists. 14. (d) Demand and supply curves do not shift in response to changes in price! 15. (a) The deadweight loss is the area between the demand curve and the supply curve from the restricted output level (10) to the equilibrium output level (30). 1/2($4 – $1)(30 – 10) = $30.. 16. (b) The minimum wage is a price floor. To be effective it is set above the equilibrium wage. As the wage increases, more workers will seek jobs but employers will demand fewer workers (a decrease in employment). 17. (c) Consumer surplus is the area between the price and the demand curve. 18. (d) Producer surplus is the area between the price and the supply curve. 19. (d) There is no deadweight loss when the market is in equilibrium. 110 Study Guide to Principles of Macroeconomics 20. (d) Consumer surplus is the area between the price and the demand curve from zero to 20 units of output. Similarly, producer surplus is the area between the price and the supply curve from zero to 20 units of output. 21. (a) The deadweight loss is the area between the demand curve and the supply curve from the restricted output level to the equilibrium output level. II. Solutions to Application Questions 1. (a) (b) (c) (d) (e) (f) (g) 2. 3. (a) $1,600,000 600,000 gallons 150,000 gallons are bought by consumers, and the rest (450,000 gallons) is taken by the government. Milk is now more expensive and less plentiful for consumers. Taxpayers—who needn’t be milk consumers—will have to pick up the subsidy tab. There will be storage and administrative costs, too. Also, there is an overallocation of resources toward milk production. At $2.00 per gallon, consumers receive 150,000 gallons. In this case there is a shortage of 450,000 gallons. The second plan is better in that the price of milk is lower for milk consumers. Deadweight loss equals 1/2($6 – $2)(400 – 150), or $500,000 (b) (c) (d) (e) (f) Nothing! A change in price leads to movements along the given demand and supply curves. The consumer surplus equals ($30 – $12)(36)/2, or $324. The producer surplus equals ($12 – 0)(36)/2 or $216. The consumer surplus equals ($30 – $21)(18)/2 + ($21 – $6)(18) or $351. The producer surplus equals ($6 – 0)(18)/2, or $54. The deadweight loss equals ($21 – $6)(36 – 18)/2 or $135. (a) Refer to the following diagram. S2 P3 S1 P2 P1 0 D1 Q3 Q2 Q1 Quantity (b) (c) (d) (e) Refer to the preceding diagram. The market is efficient, in that it is reflecting the change in supply and equalizing quantity demanded and quantity supplied. The government should impose a price ceiling to place an upper limit on price. Quantity demanded will exceed quantity supplied—there will be an excess demand. This is now a seller’s market. Output is restricted to Q3. At that output, an excess demand exists. Chapter 4: Demand and Supply Applications (f) (g) 4. 111 Suppliers may withdraw eggs from the controlled Warsaw market—selling them either outside Warsaw or on the black market within the city. Substandard (small or damaged) eggs may be offered for sale. Egg quality may be sacrificed. Other rationing methods, such as queuing or preferred customers, might be used. Black markets with higher prices are likely to develop. Eggs may be sold as part of a “package” of commodities. Higher coffee prices increased the demand for tea (a substitute). Refer to the following diagrams. Coffee market S2 P Tea market P S1 P2 P2 P1 P1 S1 D2 D 0 Q2 Q1 D1 Q 0 Q1 Q2 Q 5. (a) (b) $3; 40 Excess demand; 20 6. Higher prices would reduce quantity demanded and cut down on waiting time. If you value your time highly, you would probably be willing to pay higher prices to avoid waiting in line. 7. There was a transfer of wealth from taxpayers in general to the nation’s 2,000 commercial beekeepers. Honey consumers also lost because the market price was kept higher than it should have been. There was an overallocation of resources to honey production. Note that honey consumption was less than its most efficient level despite the excess supply. 8. Answers, of course, will vary with the auction chosen. Consumer surplus will be the value of total differences between your supposed actual price and the maximum bid of each participant. 112 Study Guide to Principles of Macroeconomics


