FMA Lab (Force Mass Acceleration) Name:
advertisement

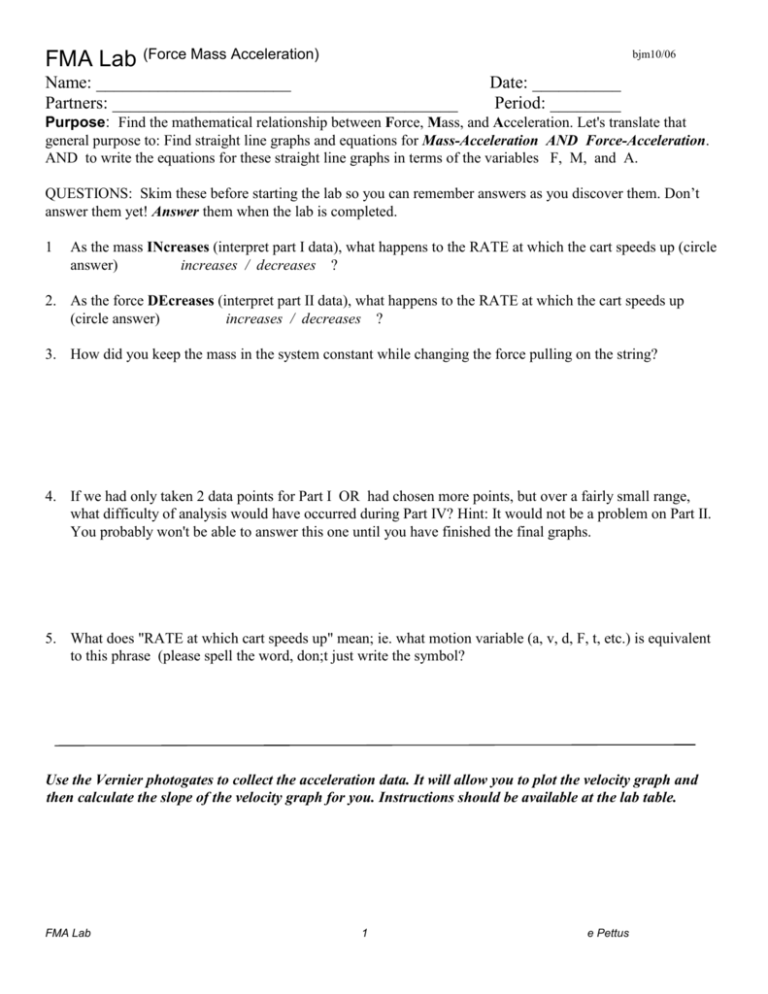
bjm10/06 FMA Lab (Force Mass Acceleration) Name: ______________________ Partners: _______________________________________ Date: __________ Period: ________ Purpose: Find the mathematical relationship between Force, Mass, and Acceleration. Let's translate that general purpose to: Find straight line graphs and equations for Mass-Acceleration AND Force-Acceleration. AND to write the equations for these straight line graphs in terms of the variables F, M, and A. QUESTIONS: Skim these before starting the lab so you can remember answers as you discover them. Don’t answer them yet! Answer them when the lab is completed. 1 As the mass INcreases (interpret part I data), what happens to the RATE at which the cart speeds up (circle answer) increases / decreases ? 2. As the force DEcreases (interpret part II data), what happens to the RATE at which the cart speeds up (circle answer) increases / decreases ? 3. How did you keep the mass in the system constant while changing the force pulling on the string? 4. If we had only taken 2 data points for Part I OR had chosen more points, but over a fairly small range, what difficulty of analysis would have occurred during Part IV? Hint: It would not be a problem on Part II. You probably won't be able to answer this one until you have finished the final graphs. 5. What does "RATE at which cart speeds up" mean; ie. what motion variable (a, v, d, F, t, etc.) is equivalent to this phrase (please spell the word, don;t just write the symbol? Use the Vernier photogates to collect the acceleration data. It will allow you to plot the velocity graph and then calculate the slope of the velocity graph for you. Instructions should be available at the lab table. FMA Lab 1 e Pettus DATA Part I Mass - Acceleration Measure the accelerations for different masses. You need at least 7 data pairs (Acc,Mass) spread out fairly evenly over a VERY wide range of mass values, all for a constant force. Your lowest mass should probably include only the cart, the timer apparatus, and the weight on the string. The next lowest should be only 0.5 kg higher. Then increase the mass in 0.5 kg jumps until you have used all your masses. Keep the 200 g mass hanging on the end of the string constant. (If you don’t know why, FIND OUT) Remember that the acceleration is the slope of the velocity vs time graph (called “M” in the software, but don’t mix this up with “M” for Mass) . The computer will graph and calculate this for you. When recording the mass ( You need to carefully design a data table in your lab book), make sure to include all the mass that moves: The mass of the cart, the mass at the end of the string, and ALL miscellaneous objects on the cart. A balance will be available at the front of the room. Mass units are Kilograms (Kg) and Acceleration units are Meters/sec/sec (m/s/s) or Meters/sec2 (m/s2). Part II Force - Acceleration Measure the accelerations for different forces. You need at least 5 data pairs (Acc,Force) spread out fairly evenly over a moderate range (50g-250g), all for a constant mass. As you will see later, the range and number of points is not as critical as in part I. Remove all the large masses from the cart, use only the “slotted” masses here. Do NOT put the large masses on the cart. When changing the force, you must keep the total mass in the system constant. This poses a problem since the total mass INCLUDES the mass on the end of the string which you will be changing. You must find a way to keep the total mass constant while changing what’s on the end of the string. Explain how in question 3. We have not studied Force units yet. Therefore, I will set a standard. The force will be equal to the value of the mass (in Kg) hanging on the end of the string times 10, and will be called Force Units Until Legal (FUUL s). If you feel like a fool while saying it, well, too bad. (Read this paragraph again – it’s important!) ================================== ANALYSIS ================================= Part III: Two Graphs: 1: mass vs. acceleration AND 2: force vs. acceleration Note that it does matter which variable is on the vertical and which is on the horizontal axis. You could use the Graphical Analysis software on the computers since they will print great graphs for you, but you may do it also by hand if you prefer. If you use some other software (such as Excel), make sure it gives you a graph size of at least half a page and will give you a “reasonable” scale (see graphing handout). IF both are fairly straight with a positive slope, you're done. Since at least one will NOT fit these criteria; go on to Part IV. FMA Lab 2 e Pettus Part IV: You need to manipulate your graph that did not yield a straight line. This is where the Graphical Analysis software comes in handy. Manipulating only the variable on the horizontal access, play around with different exponents to get a straight line graph. By choosing "New Calculated Column” you can quickly try out different graphs until you discover the proper graph. Use only the "raise to a power" option and use only integer powers (values between -2 and +2). On the graph, write the straight line equation for the variables you graphed (hint, not x and y). For this lab, let’s drop the intercept; it’s probably close to zero anyway. Of course, the alert student may pick up hints on what to graph by reading the text. Note that the units may also be changed. For example: If you plotted Mass squared, the units would be Kg squared. Change the axis and graph title to match. Do I need to mention that you need to print this graph as well? READ the RULES FOR GRAPHING handout for additional details. FINAL CONCLUSION: A) both graphs from Part III, straight or not B) your straight line graph(s) from Part IV. C) Write the equation of the line in terms of the variables F M and A for each straight line in the SPACE BELOW HERE, and on each straight line graph. This is the most important part of your conclusion. Hint: Remember your math methods for equations of graphs but without “x” and “y”. Look at your slopes – do they mean anything when compared to your lab data? D) Data table and Units everywhere (of course ! I shouldn’t insult you by listing all this.) E) Oh, the list goes on,,,,,, Read the Lab Report and Graphing handout ! By now you should know what goes on a graph, and in a lab book. Note: I suggest you get out the guidelines for graphing data that were distributed in the beginning of the year. There are requirements on those sheets that I have not repeated on this paper. Last year there were many students who lost 4 - 5 points, a few students even more, by not doing relatively simple things covered on those sheets. Normally, the only points you should lose would be on judgement questions (like one through five on the front of this lab). Don’t lose even more on silly things you could easily get by following instructions. Also, it might not hurt to read this report again to make sure you have done everything asked. FMA Lab 3 e Pettus


