Normal Distribution Notes
advertisement

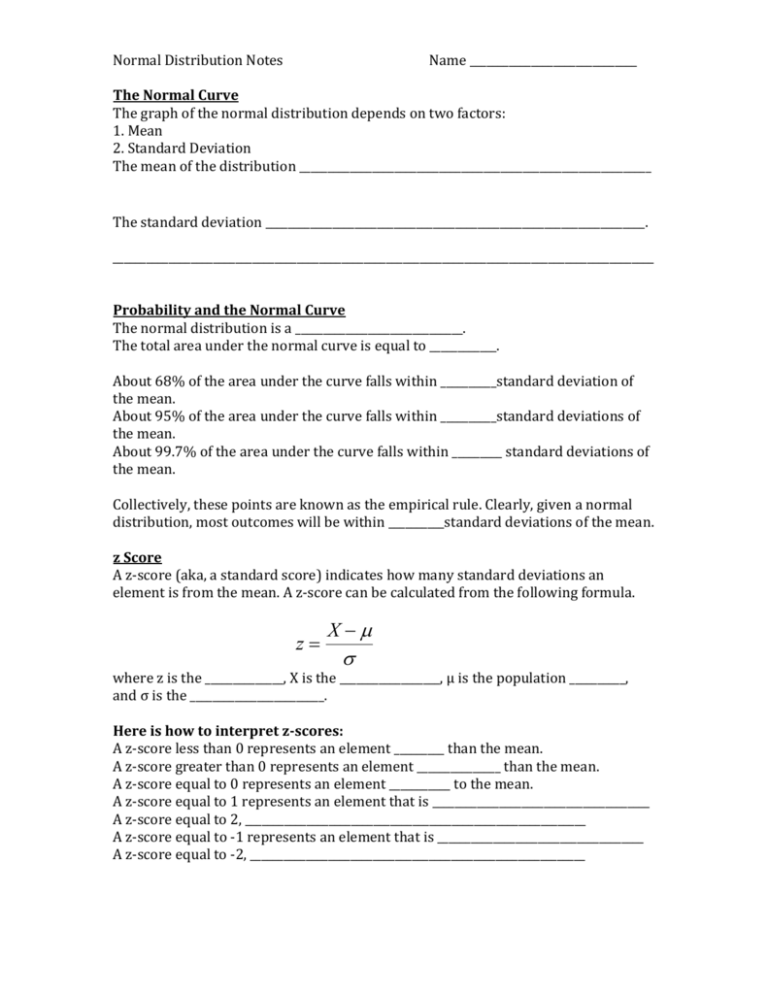
Normal Distribution Notes Name ______________________________ The Normal Curve The graph of the normal distribution depends on two factors: 1. Mean 2. Standard Deviation The mean of the distribution _______________________________________________________________ The standard deviation ____________________________________________________________________. _________________________________________________________________________________________________ Probability and the Normal Curve The normal distribution is a ______________________________. The total area under the normal curve is equal to ____________. About 68% of the area under the curve falls within __________standard deviation of the mean. About 95% of the area under the curve falls within __________standard deviations of the mean. About 99.7% of the area under the curve falls within _________ standard deviations of the mean. Collectively, these points are known as the empirical rule. Clearly, given a normal distribution, most outcomes will be within __________standard deviations of the mean. z Score A z-score (aka, a standard score) indicates how many standard deviations an element is from the mean. A z-score can be calculated from the following formula. z X where z is the ______________, X is the __________________, μ is the population __________, and σ is the ________________________. Here is how to interpret z-scores: A z-score less than 0 represents an element _________ than the mean. A z-score greater than 0 represents an element _______________ than the mean. A z-score equal to 0 represents an element ___________ to the mean. A z-score equal to 1 represents an element that is _______________________________________ A z-score equal to 2, _____________________________________________________________ A z-score equal to -1 represents an element that is _____________________________________ A z-score equal to -2, ____________________________________________________________ -If the number of elements in the set is large, about 68% of the elements have a zscore between ______________ -about 95% have a z-score between ________________ - and about 99% have a z-score between ________________. Standard Normal Distribution Table A standard normal distribution table shows a cumulative probability associated with a particular z-score. Table rows show the whole number and tenths place of the z-score. Table columns show the hundredths place. The cumulative probability (often from minus infinity to the z-score) appears in the cell of the table. Look at your tables: To find the cumulative probability of a z-score equal to -1.31, cross-reference the row of the table containing -1.3 with the column containing 0.01. The table shows that the probability that a standard normal random variable will be less than -1.31 is _____________; that is, P(Z < -1.31) = ____________ Find P(Z > a). The probability that a standard normal random variable (z) is greater than a given value (a) is easy to find. The table shows the P(Z < a). The P(Z > a) = __________________. Suppose, for example, that we want to know the probability that a z-score will be greater than 3.00. From the table (see above), we find that P(Z < 3.00) = 0.9987. Therefore, P(Z > 3.00) = _______________________ Example 1 An average light bulb manufactured by the Acme Corporation lasts 300 days with a standard deviation of 50 days. Assuming that bulb life is normally distributed, what is the probability that an Acme light bulb will last at most 365 days? Sketch a normal curve for this situation. (Hint: Find z-score first) Example 2 Molly earned a score of 940 on a national achievement test. The mean test score was 850 with a standard deviation of 100. What proportion of students had a higher score than Molly? (Assume that test scores are normally distributed.) (A) 0.10 (B) 0.18 (C) 0.50 (D) 0.82 (E) 0.90


