STA 3024 Fall 2005 Exam 2 PRINT Name
advertisement
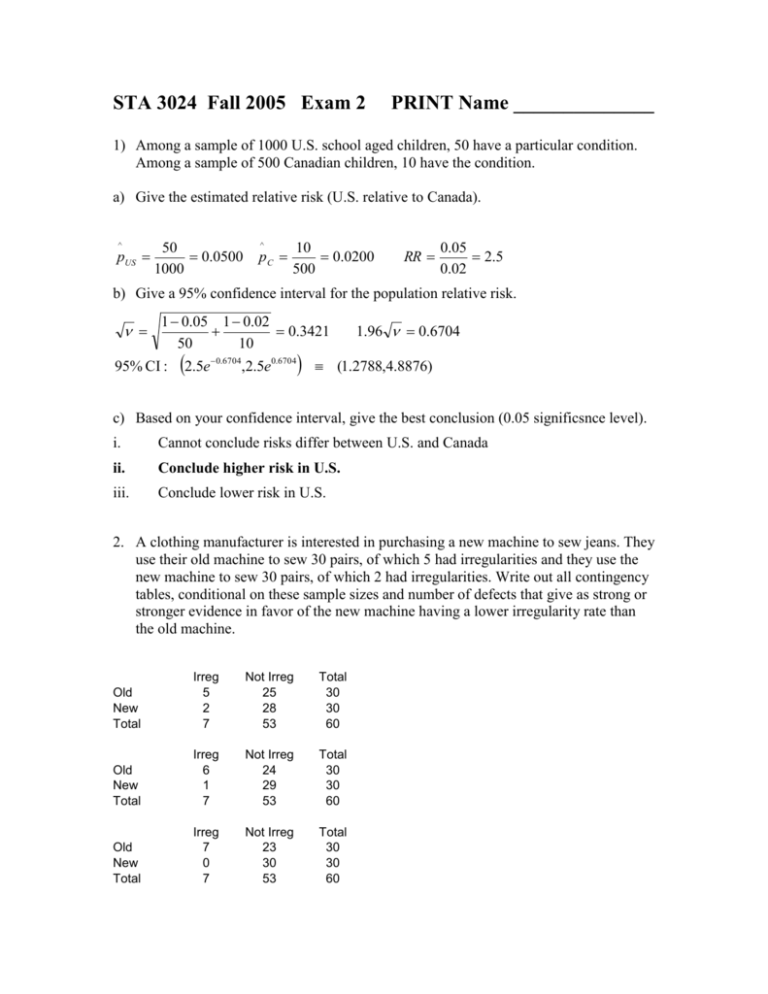
STA 3024 Fall 2005 Exam 2 PRINT Name ______________ 1) Among a sample of 1000 U.S. school aged children, 50 have a particular condition. Among a sample of 500 Canadian children, 10 have the condition. a) Give the estimated relative risk (U.S. relative to Canada). ^ pUS 50 0.0500 1000 ^ pC 10 0.0200 500 RR 0.05 2.5 0.02 b) Give a 95% confidence interval for the population relative risk. 1 0.05 1 0.02 0.3421 1.96 0.6704 50 10 95% CI : 2.5e 0.6704,2.5e0.6704 (1.2788,4.8876) c) Based on your confidence interval, give the best conclusion (0.05 significsnce level). i. Cannot conclude risks differ between U.S. and Canada ii. Conclude higher risk in U.S. iii. Conclude lower risk in U.S. 2. A clothing manufacturer is interested in purchasing a new machine to sew jeans. They use their old machine to sew 30 pairs, of which 5 had irregularities and they use the new machine to sew 30 pairs, of which 2 had irregularities. Write out all contingency tables, conditional on these sample sizes and number of defects that give as strong or stronger evidence in favor of the new machine having a lower irregularity rate than the old machine. Old New Total Irreg 5 2 7 Not Irreg 25 28 53 Total 30 30 60 Old New Total Irreg 6 1 7 Not Irreg 24 29 53 Total 30 30 60 Old New Total Irreg 7 0 7 Not Irreg 23 30 53 Total 30 30 60 3. A consumer is interested in comparing prices among 3 grocery store chains in his city. He randomly samples 10 branded products and obtains the regular price of each product at each store. He finds that between store variation accounts for 25% of the total variation and between product variation accounts for 60% of the total variation. (a) Complete the following ANOVA table. Source DF SS MS Fobs Stores 3-1=2 .25(800)=200 100 100/6.6667=15 Products 10-1=9 .6(800)=480 53.33 Error 2(9)=18 800-680=120 6.6667 Total 30-1=29 800 (b) Test whether we can conclude that the population mean prices differ among the three stores by completing the following sentence (use =0.05 significance level and circle any correct bold type options and fill appropriate numeric values in the blanks). Conclude / Do Not conclude means differ since 15 is above / below 3.555 (c) This is an example of dependent samples because (circle the best answer): i. The sample sizes for each store are the same ii. The same products are observed at each store iii. There are 3 stores 4. An advertising executive wants to compare the effectiveness of 3 ads. She samples 18 consumers, and assigns (randomly) 6 to ad 1, 6 to ad 2, and 6 to ad 3. She has each consumer rate their likelihood on a scale of 0 to 100 their purchase intentions of the product. The ratings are given below. (a) Compute the Kruskal-Wallis statistic. Ad 1 15 (1) 23 (2) 27 (3) 35 (4) 48 (6) 50 (8) Ad 2 36 (5) 49 (7) 55 (9) 64 (10) 68 (12) 70 (13) Ad 3 65 (11) 72 (14) 78 (15) 80 (16) 85 (17) 90 (18) R1 24 R2 56 R3 91 12 (24) 2 (56) 2 (91) 2 H 3(19) 70.13 57 13.13 18(19) 6 6 6 (b) Can we conclude the population distributions of purchase intentions differ at =0.05 significance level? Yes / No Why? 13.13 above / below 5.991 5. Ford wants to compare mean assembly times for Explorer’s at their 3 assembly plants. They observe random samples of 21 cars at each plant, and obtain the following summary statistics on assembly times (in minutes): Plant Mean Std. Dev. Atlanta 80 8 Chicago 85 10 Detroit 75 11 (a) Compute the between plant (Group) sum of squares and its degrees of freedom x 80 SSG 21 (0)2 (5)2 (5)2 1050 dfG 3 1 2 (b) Compute the within plant (Error) sum of squares and its degrees of freedom SSE (21 1) (8)2 (10)2 (11)2 5700 df E 63 3 60 (c) Compute the test statistic Fobs (1050 / 2) 5.53 (5700 / 60) (d) Conclude population means differ ( if the test statistic is above / below 3.150 6. For the CRD: E ( MSG ) 2 n ( i i )2 E ( MSE ) 2 Rank the following I 1 cases from lowest (1) to highest (3) for what we would “expect” the F-statistic to be: i. n1 = n2 = n3 = 10 2 (ratio=3.5) ii. n1 = n2 = n3 = 20 3 (ratio=41) iii. n1 = n2 = n3 = 5 1 (ratio=1.1) 7. A researcher is interested in comparing married men’s and women’s attitudes toward same-sex marriage. A random sample of 1000 married couples is obtained. Of these couples, both the male and female opposed it for 200 of the couples, both the male and female favored it for 300 of the couples. The male favored and the female opposed it for 280 of the couples. For the remaining couples the male opposed and the female favored. (a) Give the test statistic for testing whether the proportions of males and females favoring same sex marriage are the same (H0) or differ (HA) M \ F Favor Oppose Total z obs Favor 300 220 520 280 220 280 220 Oppose 280 200 480 Total 580 420 1000 2.68 (b) What do we conclude at the =0.05 significance level? i. Do not conclude the proportions differ ii. Conclude a higher proportion of males favor same-sex marriage iii. Conclude a higher proportion of females favor same-sex marriage 8. A Randomized Block Design is used to compare 3 types of sounds on sleep in 8 people suffering from sleeping disorders. Each subject is assigned to each sound type (in random order) and the time until the person falls asleep is measured The following calculations are obtained from a statistical software program. x1 45 x 2 65 x 3 50 MSE 100 Use Bonferroni’s method to obtain simultaneous 95% confidence intervals for all pairs of population means. Give the correct conclusion based on the intervals (NSD=”Not significantly different). Sounds Point Estimate Confidence Interval Conclude 1 vs 2 45-65 = -20 (-33.6 , -6.4) 1 < 2 1 vs 3 45-50 = -5 (-18.6 , 8.6) NSD 2 vs 3 65-50=15 (1.4 , 28.6) 2 > 3 t ** 2.718 2 SE ( x i x j ) 100 5 8 t * *SE 13.6 9 A study is conducted to find possible risk factors for a personality disorder. A sample of 500 children with the disorder is obtained, and a sample of 500 control children with similar demographic conditions (but not the personality disorder) is obtained. Mothers were asked whether they consumed alcohol during their pregnancies. The appropriate measure(s) of association to report would be: a) Relative Risk and Odds Ratio b) Relative Risk, but not Odds Ratio c) Odds Ratio, but not Relative Risk (retrospective study) d) Neither Relative Risk or Odds Ratio 10 A study is conducted comparing three methods of training subjects to draw. The experiment is conducted as a Completely Randomized Design, with 20 subjects in condition 1, 15 subjects in condition 2, and 18 subjects in condition 3. The researchers conclude (correctly) that the effects of the training methods are not equal at the 0.05 significance level and decide to use Bonferroni’s method to obtain simultaneous 95% confidence intervals for all pairs of conditions. a) Give the appropriate critical value (t) they will use to obtain the intervals 2.477 b) Which interval will be narrowest? Which will be widest? Circle the best answer. i. Narrowest: Condition 1 vs Condition 2 Widest: 2 vs 3 ii. Narrowest: Condition 1 vs Condition 3 Widest: 2 vs 3 iii. Narrowest: Condition 2 vs Condition 3 Widest: 1 vs 3 iv. Narrowest: Condition 2 vs Condition 3 Widest: 1 vs 2 v. We need more information 11 Friedman’s test is being conducted in an experiment with 4 treatments, each being applied to 8 blocks. You wish to be sure that your rankings “add up” properly. What will the total of the rank sums equal? Within each block, ranks sum to 1+2+3+4=10 8 Blocks means total is 8(10) = 80 12 Researchers in a law journal published means and standard deviations of exit velocities of bullets from 4 types of handguns. Unfortunately, they did not give the sample sizes, so you can obtain the sums of squares only up to a constant involving the sample sizes (assuming a balanced experiment). Give the rejection regions for =0.05 level test of whether the velocities differ by gun type. a) n1=n2=n3=n4=3 Conclude means not equal if Fobs F.05,3,8 = 4.066 b) n1=n2=n3=n4=8 Conclude means not equal if Fobs F.05,3,28 = 2.947 13 A study is conducted to compare the effects of 4 colors of paper on students’ ability to complete a reading task. A sample of 10 students is selected and each is given reading tasks on all four colors of paper (in random order with other tasks being completed in between). The times are highly skewed (some times were very long relative to the others). The most appropriate analysis for this experiment is: a) Kruskal-Wallis Test b) McNemar’s Test c) Friedman’s Test d) Fisher’s exact test 14 The following EXCEL output gives the results from a 1-way analysis of variance (completely randomized design). ANOVA Source Groups Error Total df 2 147 149 SS MS F P-value 1212.015 606.0075 2.206811 0.113684 40367.34 274.6078 41579.36 a) How many treatments (groups) were being compared? 2+1=3 b) How many individuals (subjects) participated? 149+1=150 c) The researchers conclude that the population group means are not all equal (at the =0.05 significance level). Is their conclusion correct? Yes / No I have not cheated on this exam _________________________________________ UFID _________________________________
