blood spatter lab - OldForensics 2012-2013
advertisement
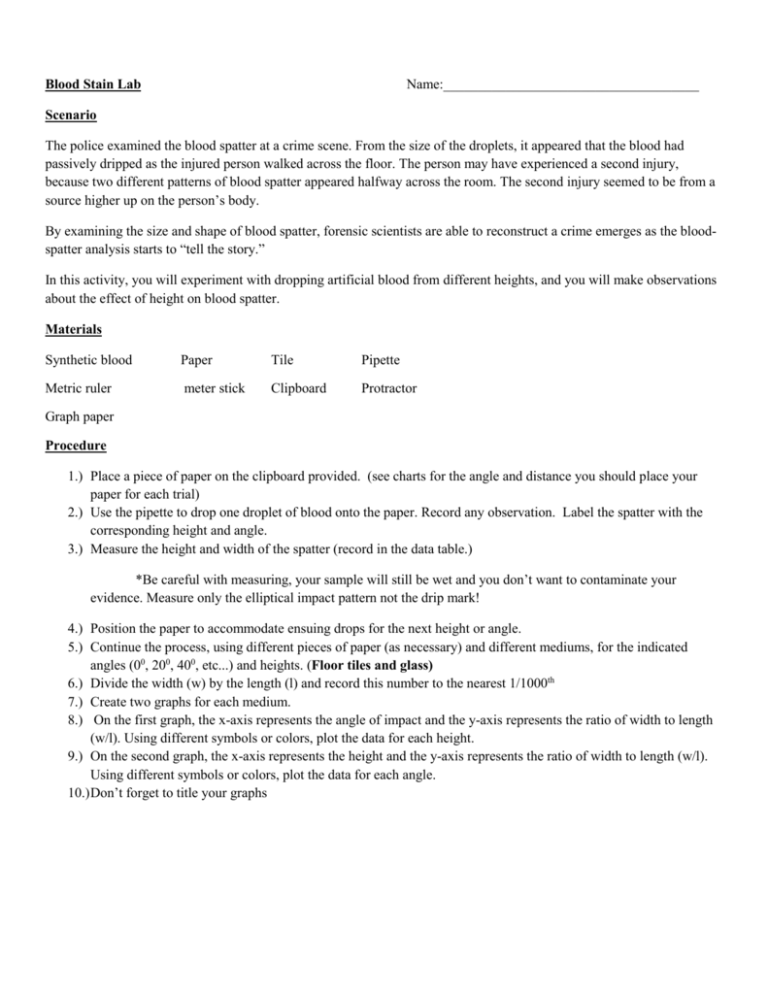
Blood Stain Lab Name:_____________________________________ Scenario The police examined the blood spatter at a crime scene. From the size of the droplets, it appeared that the blood had passively dripped as the injured person walked across the floor. The person may have experienced a second injury, because two different patterns of blood spatter appeared halfway across the room. The second injury seemed to be from a source higher up on the person’s body. By examining the size and shape of blood spatter, forensic scientists are able to reconstruct a crime emerges as the bloodspatter analysis starts to “tell the story.” In this activity, you will experiment with dropping artificial blood from different heights, and you will make observations about the effect of height on blood spatter. Materials Synthetic blood Paper Tile Pipette Metric ruler meter stick Clipboard Protractor Graph paper Procedure 1.) Place a piece of paper on the clipboard provided. (see charts for the angle and distance you should place your paper for each trial) 2.) Use the pipette to drop one droplet of blood onto the paper. Record any observation. Label the spatter with the corresponding height and angle. 3.) Measure the height and width of the spatter (record in the data table.) *Be careful with measuring, your sample will still be wet and you don’t want to contaminate your evidence. Measure only the elliptical impact pattern not the drip mark! 4.) Position the paper to accommodate ensuing drops for the next height or angle. 5.) Continue the process, using different pieces of paper (as necessary) and different mediums, for the indicated angles (00, 200, 400, etc...) and heights. (Floor tiles and glass) 6.) Divide the width (w) by the length (l) and record this number to the nearest 1/1000th 7.) Create two graphs for each medium. 8.) On the first graph, the x-axis represents the angle of impact and the y-axis represents the ratio of width to length (w/l). Using different symbols or colors, plot the data for each height. 9.) On the second graph, the x-axis represents the height and the y-axis represents the ratio of width to length (w/l). Using different symbols or colors, plot the data for each angle. 10.) Don’t forget to title your graphs Paper 00 15cm w= l= w/l= 45cm w= l= w/l= 75cm w= l= w/l= 105cm w= l= w/l= 135cm w= l= w/l= 165cm w= l= w/l= w= l= w/l= w= l= w/l= w= l= w/l= w= l= w/l= w= l= w/l= w= l= w/l= w= l= w/l= w= l= w/l= w= l= w/l= w= l= w/l= w= l= w/l= w= l= w/l= w= l= w/l= w= l= w/l= w= l= w/l= w= l= w/l= w= l= w/l= w= l= w/l= Observations 200 Observations 400 Observations 600 Observations Repeat with Floor tiles and Glass Post lab 1.) Is there a relationship between the height from which the blood is dropped and the size of the blood spatter droplets? Support your answer with data. 2.) Blood is dropped at 15 cm and 165 cm with a 00 angle. Compare and contrast the outer edges of blood droplets produced from these two heights. 3.) Examine your results. Is there a relationship between the height from which the blood is dropped and the number of satellites produced? 4.) Examine your results. Is there a relationship between the medium to which the blood is dropped on to and the number of satellites produced? 5.) Is there a relationship between the medium to which the blood is dropped on to and the size of the blood spatter droplets? Support your answer with data. 6.) How accurate were you in obtaining the desired angles of impact? 7.) Provide an example of how knowing the actual angle of impact could help investigators solve crimes. 8.) Based on the analyses performed in this lab, could someone determine both angle of impact and distance fallen from a single bloodstain? Explain. 9.) Would results differ if a different liquid was used instead of fake blood? Explain.
