Problem Set 1
advertisement

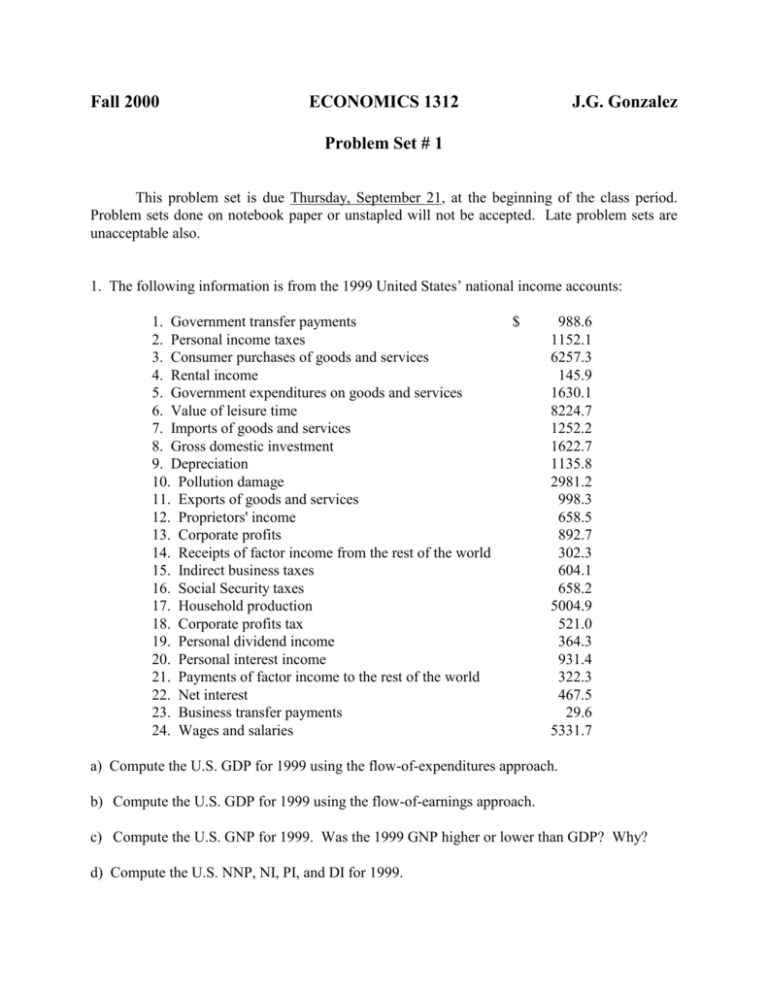
Fall 2000 ECONOMICS 1312 J.G. Gonzalez Problem Set # 1 This problem set is due Thursday, September 21, at the beginning of the class period. Problem sets done on notebook paper or unstapled will not be accepted. Late problem sets are unacceptable also. 1. The following information is from the 1999 United States’ national income accounts: 1. Government transfer payments 2. Personal income taxes 3. Consumer purchases of goods and services 4. Rental income 5. Government expenditures on goods and services 6. Value of leisure time 7. Imports of goods and services 8. Gross domestic investment 9. Depreciation 10. Pollution damage 11. Exports of goods and services 12. Proprietors' income 13. Corporate profits 14. Receipts of factor income from the rest of the world 15. Indirect business taxes 16. Social Security taxes 17. Household production 18. Corporate profits tax 19. Personal dividend income 20. Personal interest income 21. Payments of factor income to the rest of the world 22. Net interest 23. Business transfer payments 24. Wages and salaries $ 988.6 1152.1 6257.3 145.9 1630.1 8224.7 1252.2 1622.7 1135.8 2981.2 998.3 658.5 892.7 302.3 604.1 658.2 5004.9 521.0 364.3 931.4 322.3 467.5 29.6 5331.7 a) Compute the U.S. GDP for 1999 using the flow-of-expenditures approach. b) Compute the U.S. GDP for 1999 using the flow-of-earnings approach. c) Compute the U.S. GNP for 1999. Was the 1999 GNP higher or lower than GDP? Why? d) Compute the U.S. NNP, NI, PI, and DI for 1999. 2. a) Use aggregate supply and demand analysis to explain the macroeconomic consequences of the devaluation of the Argentinean Peso for their economy. b) Assume that Fernando de la Rúa says that he wants to follow non-accommodative economic policy in response to the changes in part a). What fiscal policies would you suggest be used? What monetary policies could also be used? Use a diagram to show the effects of your suggested polices. 3. You are the President's economic advisor and you are trying to figure out where the U.S. economy is headed next year. You have the following forecasts for next year's AD, short-run AS, and long-run AS curves (output is given in trillions of 1998 dollars): Price Level 176 178 180 182 Real GDP Demanded 10.3 10.0 9.7 9.4 Real GDP Supplied in the short run 9.1 9.4 9.7 10.0 Long-run Aggregate Supply 9.5 9.5 9.5 9.5 This year, real GDP is $9.3 trillion and the price level is 174. The President wants answers to the following questions: a) b) c) d) e) What is your forecast of next year's real GDP? What is your forecast of next year's price level? What is your forecast of the inflation rate? What will happen to the unemployment rate? Will real GDP be above or below trend? By how much? 4. Use the information in problem 3 to answer the following questions (use diagrams in your answers): a) What will have to be done to aggregate demand to move the economy to potential output? What type of monetary policy could be used to achieve this objective? What fiscal policy could be used to achieve this objective? b) What will the price level be if aggregate demand is manipulated to move the economy to potential output? (For simplicity you can assume that the AD and AS are straight lines). 5. Use the information available on the Internet ( http://www.stls.frb.org/fred/data/wkly.html ) to obtain the data necessary to answer the following questions. a) What were the interest rates on 3-month U.S. Treasury bills (the data series is called: 3Month Constant Maturity Rate –daily-) on: i. January 4, 1999 ii. April 1, 1999 iii. July 1, 1999 iv. October 1, 1999 b) What were the interest rates on 10-year U.S. Treasury bonds (the data series is called: 10Year Constant Maturity Rate –daily-) on: i. January 4, 1999 ii. April 1, 1999 iii. July 1, 1999 iv. October 1, 1999 c) Draw the yield curves for: i. January 4, 1999 ii. April 1, 1999 iii. July 1, 1999 iv. October 1, 1999 d) What were the changes in the yield curve from Jan. 4, 1999 to October 1, 1999 predicting about the future of the U.S. economy for 2000? Explain. On the basis of that information, what actions would you have recommended the Fed take at that time? Why? e) Find the corresponding interest rates for September 8, 2000. What are the changes in the yield curve from October 1, 1999 to September 8, 2000 predicting about the future of the U.S. economy for 2001? Explain. f) What is the probability of a recession according to the yield curve of September 8, 2000? (Note: Use the diagram from the WSJ article (Aug. 12, 1996) that we discussed in class to answer this question). 6. The country of Dawson has 130 million people over the age of 16. You are told that there is only one wage in the economy and that it is equal to $25 per hour. At this wage 90 million people are willing to work. You are told that when the wage equals $25 per hour there is no involuntary unemployment in Dawson. a) Use the geometry of supply and demand to describe the labor market of Dawson (Make sure that you show the number of workers employed, voluntarily unemployed, and the total population). b) Suppose that as a result of a decline in consumption and investment expenditures, 20 million workers become involuntarily unemployed. Illustrate these changes with the use of a new diagram (Make sure that you show the number of workers that are employed, involuntarily unemployed, voluntarily unemployed, and the total population). c) What assumption is necessary to generate involuntary unemployment in the labor market?


