Fulltext
advertisement
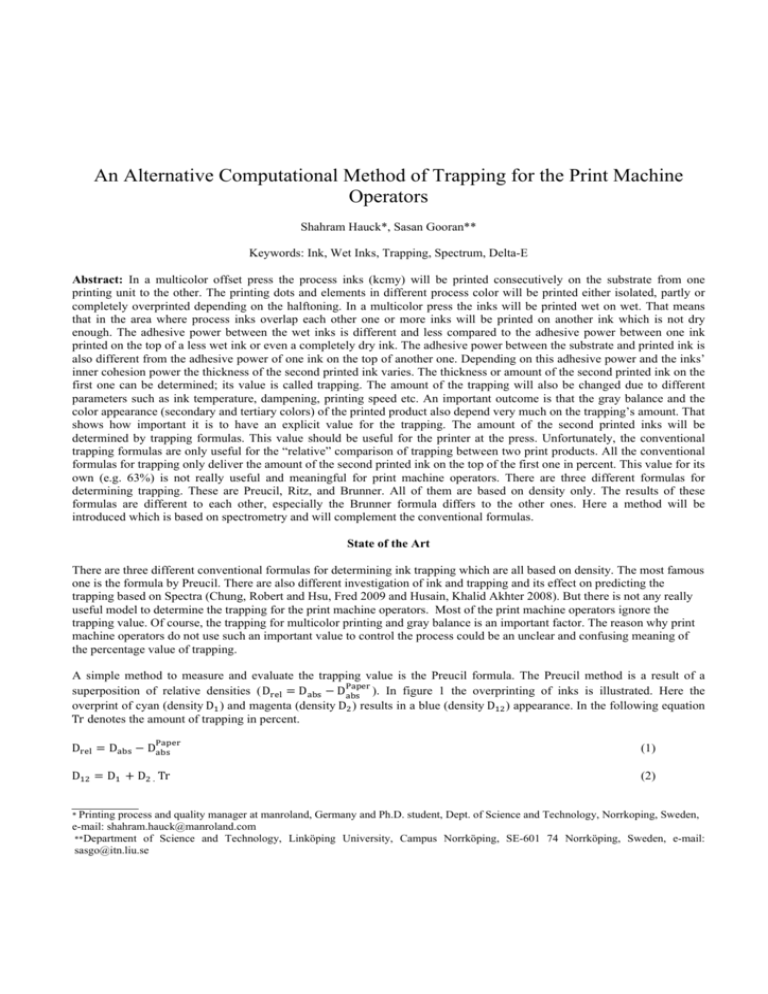
An Alternative Computational Method of Trapping for the Print Machine Operators Shahram Hauck*, Sasan Gooran** Keywords: Ink, Wet Inks, Trapping, Spectrum, Delta-E Abstract: In a multicolor offset press the process inks (kcmy) will be printed consecutively on the substrate from one printing unit to the other. The printing dots and elements in different process color will be printed either isolated, partly or completely overprinted depending on the halftoning. In a multicolor press the inks will be printed wet on wet. That means that in the area where process inks overlap each other one or more inks will be printed on another ink which is not dry enough. The adhesive power between the wet inks is different and less compared to the adhesive power between one ink printed on the top of a less wet ink or even a completely dry ink. The adhesive power between the substrate and printed ink is also different from the adhesive power of one ink on the top of another one. Depending on this adhesive power and the inks’ inner cohesion power the thickness of the second printed ink varies. The thickness or amount of the second printed ink on the first one can be determined; its value is called trapping. The amount of the trapping will also be changed due to different parameters such as ink temperature, dampening, printing speed etc. An important outcome is that the gray balance and the color appearance (secondary and tertiary colors) of the printed product also depend very much on the trapping’s amount. That shows how important it is to have an explicit value for the trapping. The amount of the second printed inks will be determined by trapping formulas. This value should be useful for the printer at the press. Unfortunately, the conventional trapping formulas are only useful for the “relative” comparison of trapping between two print products. All the conventional formulas for trapping only deliver the amount of the second printed ink on the top of the first one in percent. This value for its own (e.g. 63%) is not really useful and meaningful for print machine operators. There are three different formulas for determining trapping. These are Preucil, Ritz, and Brunner. All of them are based on density only. The results of these formulas are different to each other, especially the Brunner formula differs to the other ones. Here a method will be introduced which is based on spectrometry and will complement the conventional formulas. State of the Art There are three different conventional formulas for determining ink trapping which are all based on density. The most famous one is the formula by Preucil. There are also different investigation of ink and trapping and its effect on predicting the trapping based on Spectra (Chung, Robert and Hsu, Fred 2009 and Husain, Khalid Akhter 2008). But there is not any really useful model to determine the trapping for the print machine operators. Most of the print machine operators ignore the trapping value. Of course, the trapping for multicolor printing and gray balance is an important factor. The reason why print machine operators do not use such an important value to control the process could be an unclear and confusing meaning of the percentage value of trapping. A simple method to measure and evaluate the trapping value is the Preucil formula. The Preucil method is a result of a superposition of relative densities (D = D − D ). In figure 1 the overprinting of inks is illustrated. Here the overprint of cyan (density D ) and magenta (density D ) results in a blue (density D ) appearance. In the following equation Tr denotes the amount of trapping in percent. D = D − D (1) D = D + D . Tr (2) * Printing process and quality manager at manroland, Germany and Ph.D. student, Dept. of Science and Technology, Norrkoping, Sweden, e-mail: shahram.hauck@manroland.com **Department of Science and Technology, Linköping University, Campus Norrköping, SE-601 74 Norrköping, Sweden, e-mail: sasgo@itn.liu.se Figure 1. A part of a print quality control strip for measuring the trapping. The equations 1 and 2 result in the Preucil formula: Tr = ∙ 100 (3) The Ritz formula for determining the percentage of the trapping value: R = R + R . Tr + 1 − Tr . R Tr = (4) (5) R : denotes the re'lection of the 'irst printed ink R : denotes the re'lection of the second printed ink R : denotes the re'lection of the overlaped inks Equivalent to the density value: Tr = 012 12 012 . 100 (6) Both formula of Preucil and Ritz deliver a percentage value. As mentioned before the meaning and interpretation of that value alone is very limited for the print machine operators. Range and tolerance for trapping There is no general value, range or tolerance known for the conventional trapping method. An Alternative Computational Method of Trapping for the Print Machine Operators Many experts have investigated the inks via spectrometry but there are no investigations with the aim to create a model for determining the trapping which achieves a high acceptance by the print machine operators. In this paper a method is suggested that achieves clearer, more understandable and usable value of trapping compared to the conventional method of trapping determination. This method is similar to the Preucil method and compares the calculated theoretical total overlapped “ink result” (which is in practice < 1) with the measured overlapped “ink result”. The difference is the kind of measuring. The measurement is spectrally based and the determined value is not “only” a percentage value. The result is the color difference between the calculated theoretically totally overlapped spectrum and the measured overlapped spectrum which is much more understandable and usable for the print machine operators. To take a close look at trapping its principle is shown in figure 2. It is an interaction of light and paper and light, paper and inks respectively. Figure 2. A schematic of a solid value print involving paper, cyan, magenta and ink overlapping For the interaction of a light source Sλ and paper (figure 2 left) the light after being reflected from the surfaces of paper 89: β λ is φ λ (equation 7). For interaction including ink the resulting stimulus is for the first single ink (i.e. cyan) φ7 λ 89: (equation 8) and for the second single ink (i.e. magenta) φ; λ (equation 9), respectively. The overprinting results in λ (equation 10). T89 λ denotes the n times transmittance of the ink film. φ<= φ λ = Sλ. β λ (7) 89: λ = Sλ. T7 λ. β λ (8) 89: λ = Sλ. T; λ. β λ (9) φ7 φ; λ. φ<= β λ λ = Sλ. T7 λ. T; (10) The spectral reflectance is achieved by dividing the stimulus of the light source R<= = D >@ABC ? (11) ED λ. R<= = T7 λ. T; β λ (12) For calculating the trapping the measured and the theoretically totally overlapped spectral reflectance of blue is needed. Theoretically the reflectance spectrum of the two overlapped inks is calculated by multiplying the spectral reflectance of both 89: 89: single patches R 7 λ and R ; λ. However there is the need to eliminate one paper spectral reflectance (equation 16). R λ = 89: R7 89: R; >F D ED = β λ HIJKLB λ = >G λ = >M D = T7 λ. β λ (14) D λ. = T; β λ (15) ED NOPQRSTUV W = HIJKLB ED HIJKLB >G (13) HIJKLB D∙>M XY ∙Z[ Y D HIJKLB = G HIJKLB λ∙M βF λ λ = \ G D.]F D∙\M D.]F D βF λ λ. = T7 λ. T; β λ (16) As can be seen the equation 12 and 16 are the same. The equation 12 shows the measured reflectance of overlapped inks. The equation 16 shows the theoretical reflectance of cyan and magenta reflectance. Here it should be demonstrated that there is a direct relationship between both measured and calculated values. Figure 3 shows the measured spectral reflectance of the single inks, overlapped inks and the theoretically calculated overlapped inks. Figure 3. The spectral reflectance curves of the overlapped and calculated inks. c denotes cyan, m magenta, y yellow, c+m measured the overlapping of magenta on cyan, c+y measured the overlapping of yellow on cyan, m+y measured the overlapping of yellow on magenta, c+m+y measured the overlapping of yellow on blue. The dashed lines are the corresponding spectral curves of calculated overlapping. PW is the spectral reflectance of the paper. In the next step XYZ- tristimulus value have to be calculated from the spectral reflectance of equation 12 and 16. Calculation of X,Y,Z according to the CIE recommendation: 00 X=∑ . ∑D Rλ . Sλ . xdλ ∆λ (17) b ED.àD∆D The other two tristimulus values (Y and Z) are to be calculated correspondingly to equation 17. From the XYZ- tristimulus values the Lab value has to be determined (Kang, 2006). Lab values in our practice test are calculated with X 9, Y9, Z9 for the light source D50 and CIE 1976 standard observer (2° observer). X 9, = 96.42 Y9, = 100.00 Z9, = 82.53 In a last step the Delta-E has to be calculated between the calculated theoretically overlapped ink values and the measured overlapped ink values. According to the CIE 1976 color difference: ∗ ∆E = q[∆L∗ + ∆a∗ + ∆b ∗ ] (18) ∆L* denotes the difference between the L* value of measured reflectance from the overlapped inks and the L* value from the reflectance of theoretically and calculated (ideal overlapping) inks. ∆a*and ∆b*are related correspondingly to ∆L*. Results Sample no Table 1 shows the measured overlapped L*a*b* values and the calculated L*a*b* values. The color difference formula for the ∆E*ab value is equation 18. It is also possible to use delta-E 96 or any other color difference formula. 1 2 3 4 Color combination m+y c+y c+m blue+y m+y c+y c+m blue+y m+y c+y c+m blue+y m+y c+y c+m blue+y Derived from measuring spectral overlapping (overlapped patch) L* a* b* Derived from measuring spectral overlapping (single color patches) L* a* b* 46.2 63.8 40.0 44.2 64.6 53.3 49.7 -63.2 23.2 47.6 -64.5 28.6 24.8 19.8 -45.8 16.3 24.9 -45.2 23.5 -1.4 -4.2 12.1 6.9 3.8 46.2 64.1 40.5 44.0 65.1 53.6 49.6 -63.8 23.5 47.3 -65.1 28.9 25.2 19.1 -45.6 16.0 25.4 -45.8 23.7 -1.2 -4.6 11.6 6.8 3.6 46.5 63.4 41.1 44.0 65.0 54.3 49.3 -63.1 21.9 46.9 -64.5 30.0 25.7 17.7 -45.9 15.8 25.2 -45.2 24.9 -4.3 -4.1 11.5 7.1 4.5 46.5 63.5 40.9 43.9 65.6 54.1 49.3 -63.1 21.1 46.8 -65.2 29.4 25.9 16.8 -46.1 15.4 25.6 -45.8 24.8 -3.8 -4.5 11.1 7.0 3.7 Trapping value according to: ∆E*ab 14 6 10 16 13 6 11 17 Preucil 63 75 65 53 65 75 64 52 Ritz 90 95 93 85 91 95 93 84 14 9 12 20 14 9 14 19 63 69 60 50 63 70 58 51 90 93 92 83 90 93 91 84 Correlation coefficient between the new and the corresponding conventional method: -0.96 * * * * -0.93 Table 1. The L a b , ∆E ab, and correlation value between the suggested method and the conventional method. The meaning of ∆E*ab as a trapping value is easier and more understandable compared to the percentage value of trapping. (c+m)+y denotes the trapping value between the secondary color red (which is the result of the overprinting of cyan and magenta) and the primary color yellow. blue+y In table 1 and figure 4 one can also see the high correlation (linear correlation coefficient) between the ∆E*ab and the results gained by the conventional methods. But the meaning and understanding of a color difference value for the print machine operators is more obvious. In practice test the print machine operators give some positive feedback about the work with the introduced trapping value. Print machine operators have to work with color difference value (in modern print shops) every day. The operators have a feeling for the color difference values and can assess the result of color difference values better compared to a percentage value of trapping. A second advantage is the higher dynamic range of trapping value based on color difference compared to the conventional trapping methods. Table 2 compares the second sample sheet (table 1, blue + y) and the third sample sheet (table 1, blue + y). Table 2 demonstrates the relative difference of trapping value calculated between the second and the third sample sheet (blue + y). The value “relative difference” (relative difference = difference x 100 : trapping of sample no. 2) in table 2 describes how sensitive a model will be if the trapping between two samples changes. ∆E*ab Sample no Preucil Ritz 2 16.6 52.5 84.3 3 19.5 49.8 83.2 2.9 2.7 1.1 17.6 5.1 1.3 Difference Rel. Difference [%] Table 2.The value “relative difference” demonstrates how sensitive a model will be if the trapping between two sample changes. As can be seen the dynamic range of the recommended trapping method is the largest number. With 17.6 % is the dynamic range of the ∆E*ab trapping method is almost 3.5 times higher than the dynamic range of the Preucil method and 13.5 times higher than the one of the Ritz method. The advantage of a high dynamic range for the print machine operators is to have a more sensitive trapping value. That helps the print machine operators to differentiate the results of trapping better in order to react faster and control the ink and the press earlier. Figure 4. The graphic shows the trend of linear slope for different determined trapping values from table 1. Conclusion We tested the suggested method in practice. For the print machine operators it is more understandable to work and control the printing process with the suggested method compared to the conventional methods by using a percentage value. The suggested method has a high dynamic range for the print machine operators. That means the trapping value based on color difference method is a more sensitive trapping value compared to the conventional methods. By using this new method the results of trapping can be differentiated better. This helps the press operator to react faster and control the ink earlier. Reference Chung, Robert and Hsu, Fred 2008 “A study of ink trapping and ink trapping ratio” http://cias.rit.edu/~gravure/tt/pdf/pc/TT8_A%20Study%20of%20Ink%20Trapping%20and%20Ink%20Trapping%20R atio.pdf 2009 “Predicting color of overprint solid” Advances in Printing Science and Technology Vol. XXXVI, iarigai Hauck, Shahram 2007a “Feuchtwerk für eine Druckmaschine“, patent DE102006002502A1 2007b “Verfahren zur Erfassung druckqualitätsrelevanter Parameter an einem Druckprodukt“, patent DE102006010180A1 2009 “Druckmaschine, sowie Verfahren zur Abstimmung der Farb- und Feuchtwerkseinstellungen“ patent E102008007272A1 Husain, Khalid Akhter 2008 "Predicting spot-color overprints” http://cias.rit.edu/~gravure/tt/pdf/pc/TT8_Predicting%20SpotColor%20Overprints.pdf Kang, Henry R. 2006 “Computational color technology” ISBN 0-8194-6119-9 Kipphan, Helmuth Prof. 2008 “Handbook of print media” ISBN-10: 3540669418 Simon, Klaus 2007 “Farbe im digitalen Publizieren“ ISBN 978-3-540-37327-8
