Major Electrolytes
advertisement
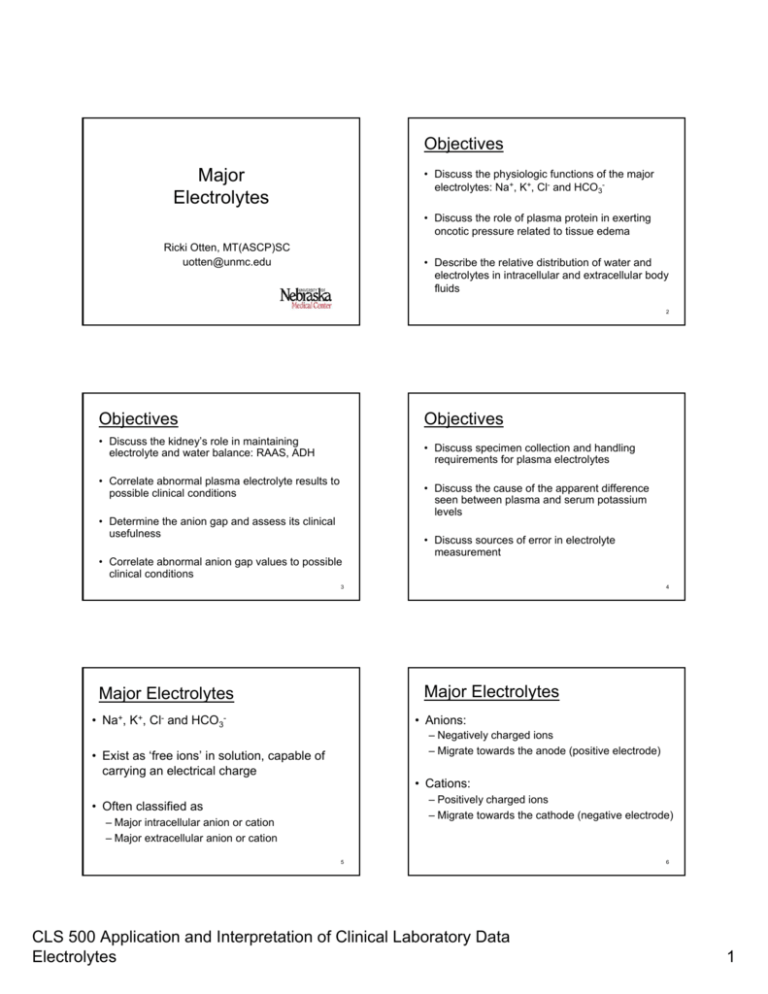
Objectives Major Electrolytes • Discuss the physiologic functions of the major electrolytes: Na+, K+, Cl- and HCO3• Discuss the role of plasma protein in exerting oncotic pressure related to tissue edema Ricki Otten, MT(ASCP)SC uotten@unmc.edu • Describe the relative distribution of water and electrolytes in intracellular and extracellular body fluids 2 Objectives Objectives • Discuss the kidney’s role in maintaining electrolyte and water balance: RAAS, ADH • Discuss specimen collection and handling requirements for plasma electrolytes • Correlate abnormal plasma electrolyte results to possible clinical conditions • Discuss the cause of the apparent difference seen between plasma and serum potassium levels • Determine the anion gap and assess its clinical usefulness • Correlate abnormal anion gap values to possible clinical conditions • Discuss sources of error in electrolyte measurement 3 4 Major Electrolytes Major Electrolytes • Na+, K+, Cl- and HCO3- • Anions: – Negatively charged ions – Migrate towards the anode (positive electrode) • Exist as ‘free ions’ in solution, capable of carrying an electrical charge • Cations: – Positively charged ions – Migrate towards the cathode (negative electrode) • Often classified as – Major intracellular anion or cation – Major extracellular anion or cation 5 CLS 500 Application and Interpretation of Clinical Laboratory Data Electrolytes 6 1 Major Electrolytes Major Electrolytes • Virtually every metabolic process depends on the presence of electrolytes • Body has complex systems for monitoring and maintaining electrolyte concentrations in a narrow normal range • Electrolytes create an ‘electric potential’ • Abnormal electrolytes may be the cause or consequence of a disorder or disease process • Electric potential is needed to do ‘cellular work’ 7 8 Physiologic Functions Importance of Body Water • Maintenance of osmotic pressure and water distribution (water homeostasis) • Conduction of neuromuscular impulses • Acid-base maintenance • Enzyme activation • Electron transfer • Water is the solvent for all body processes – Transports nutrients to cells – Determines cell volume – Removes waste products – Acts as the body’s coolant system 9 10 Total Body Water Water Homeostasis • Intracellular (ICF) ~ 2/3 total body water • Maintenance of normal protein and electrolyte concentrations controls water distribution in these compartments • Extracellular (ECF) Intravascular ECF (plasma) Interstitial cell fluid • Water passes freely across cell membranes • Ions and proteins cannot freely diffuse across most cell membranes 11 CLS 500 Application and Interpretation of Clinical Laboratory Data Electrolytes 12 2 Osmotic Pressure Regulation of Osmolarity • The concentration of proteins and ions on one side of a membrane or the other will influence the flow of water across that membrane • Osmolarity of ECF is controlled by the – Kidney – Renin-angiotensin-aldosterone system – Hypothalamus (thirst and ADH) – Atrial natriuretic factor • Sodium and its related anions account for ~90% of the osmotic activity in plasma (major osmo-regulator) 13 Regulation of Osmolarity 14 Regulation of Osmolarity • Thirst sensation Increases water content of ECF (and decreases Na+) • Antidiuretic hormone Acts on DCT and collecting ducts in kidney to reabsorb water 15 16 Sodium (Na+) Regulation of Osmolality • Aldosterone: Stimulates sodium (and H2O) retention by kidney (at expense of K+) • Major cation in ECF (plasma) • Responsible for almost ½ the osmotic strength of plasma 17 CLS 500 Application and Interpretation of Clinical Laboratory Data Electrolytes 18 3 Sodium (Na+) Regulation Hyponatremia – Decreased Na+ • Kidneys are the primary regulators of body sodium and water • Sodium is freely filtered by glomerulus, 70-80% actively reabsorbed by PCT • Increased sodium loss by kidney: – – – – Decreased aldosterone production Diuretics (thiazides) Ketonuria (sodium is lost with ketones) Potassium deficiency (Na+ into urine to conserve K+) • Increased sodium loss by GI tract: – Prolonged vomiting – Prolonged diarrhea • In times of deficit all sodium is reabsorbed by kidney 19 20 Hyponatremia – Decreased Na+ Hyponatremia – Decreased Na+ • Increased water retention (causes dilution of plasma sodium) • Water imbalance: excess water intake resulting in sodium dilution – – – – Nephrotic syndrome Hepatic cirrhosis Acute and chronic renal failure Congestive heart failure (CHF) – Increased ADH production (SIADH) resulting in body water intoxication – Defect in ADH regulation: pulmonary disease, malignancies, CNS disorders, infections, trauma Loss of protein Æ decreased osmotic pressure Æ edema Æ low plasma volume Æ ADH Æ fluid retention Æ dilution • Hyperglycemia - increased glucose forces water out of the cell into the plasma resulting in a dilution of sodium 21 22 Hypernatremia – Increased Na+ Hypernatremia – Increased Na+ • Excess loss of water compared to sodium loss (loss of hypotonic fluid) • Decreased water intake (dehydration) – Elderly – Infants – Adults with impaired mental status – Profuse sweating, fever, exposure to heat – Prolonged diarrhea, vomiting – Severe burns • Increased sodium intake or retention – Diet – IV infusion – Increased aldosterone secretion – Diabetes insipidus with impaired thirst mechanism (neurogenic or nephrogenic) 23 CLS 500 Application and Interpretation of Clinical Laboratory Data Electrolytes 24 4 Potassium (K+) Potassium (K+) Regulation • Major intracellular cation • Neuromuscular excitability, heart contractions, maintain ICF volume, maintain H+ concentration • Na+-K+-ATP-ase pump continually transports K+ into cells against concentration gradient • High intracellular ‘stores’ aid to maintain nearnormal extracellular K+ levels in times of deficit K+ • 23x higher in RBC compared to plasma; higher in tissue cells K+ 25 Potassium (K+) Regulation 26 Hypokalemia – Decreased K+ • Kidney response to conserve K+ is not as immediate and thorough as its response to conserve Na+ • Decreased dietary intake • Aldosterone: when sodium is retained, K+ (or H+) is excreted into urine • Renal loss • Increased cellular uptake – Excess insulin, alkalosis, catecholamines – Hyperaldosteronism, RTA, magnesium deficiency, diuretics (thiazides) • GI loss – Vomiting, diarrhea, laxative abuse, malabsorption 27 Hyperkalemia – Increased K+ Hyperkalemia – Increased K+ • Intracellular to extracellular shift • Increased intake – Dietary – IV infusion (most common cause in hospitalized patients) • Increased cellular release – – – – – 28 – Metabolic acidosis – Diabetes mellitus - insulin deficiency, hyperglycemia • Impaired renal excretion Tissue damage from crushing injury, trauma Chemotherapy, massive blood transfusion Exercise (transient) Phlebotomy (fist clenching, prolonged use of tourniquet) Hemolysis – Acute or chronic renal failure – Hypoaldosteronism (Na+ lost into urine, K+ retained) – Addison’s disease • Some medications – impair K+ entry into cell 29 CLS 500 Application and Interpretation of Clinical Laboratory Data Electrolytes 30 5 Chloride (Cl-) Chloride (Cl-) Regulation • Filtered by glomerulus, passively reabsorbed by the proximal tubules and actively reabsorbed by the ascending Loop of Henle • Major anion in ECF • Most often Cl- ions shift with Na+ (passive association) and HCO3- to maintain electrical neutrality, osmolality and blood volume 31 Chloride (Cl-) Regulation 32 Chloride (Cl-) Disorders • Chloride disorders often parallel the causes of sodium disorders due to passive association with sodium • Chloride shift: maintains anion-cation balance during buffering process in response to cellular metabolism • Hypochloremia: associated with high bicarbonate levels seen in metabolic alkalosis or compensated respiratory acidosis • Hyperchloremia: associated with metabolic acidosis due to excess loss of bicarbonate 33 Bicarbonate – HCO3- Bicarbonate (HCO3-) Regulation • Filtered by the glomerulus and reabsorbed in the proximal and distal tubules • 2nd most abundant anion in ECF • Maintenance of acid/base balance as the major buffer ion in the carbonic acid/bicarbonate buffer system; major component (>95%) of total CO2 (tCO2) 34 • Kidney has the capacity to reabsorb all or none of the filtered HCO3as needed to maintain acid/base balance in body 35 CLS 500 Application and Interpretation of Clinical Laboratory Data Electrolytes 85% HCO3- 15% HCO3- 36 6 Decreased Bicarbonate (HCO3-, tCO2) Increased Bicarbonate (HCO3-, tCO2) • Metabolic acidosis • Metabolic alkalosis – Renal failure – Renal tubular acidosis (RTA) – Ketoacidosis – Lactic acidosis – Severe vomiting – Excess ingestion of antacids (alkali) – Hypokalemia • Renal compensation for respiratory acidosis • Diarrhea • Renal compensation for respiratory alkalosis 37 38 Anion Gap Anion Gap • Calculated parameter: Na+ – (Cl- + tCO2) • Normal anion gap = 7 - 16 • An estimate of the concentration of anions not normally measured in plasma • Assessment made on every set of electrolytes • Used clinically to detect the presence of metabolic disorders affecting electrolyte balance • Normal anion gap = 7 - 16 39 40 Anion Gap Cation and Anion Balance • Cations and anions are always in balance to maintain electrical neutrality Measured: Na+ - (Cl- + tCO2) 142 – (103 + 28) = 11 Unmeasured cations 5 Ca2+ 2 Mg2+ + 4 K Total 11 • The sum of all anions = sum of all cations Unmeasured anions Protein 17 Phosphate 1 Sulfate 1 Organic acids 3 Total 22 Anion gap estimates amount of anions not normally measured = 22 – 11 = 11 Normal = 7 - 16 41 CLS 500 Application and Interpretation of Clinical Laboratory Data Electrolytes 42 7 Low Anion Gap High Anion Gap • Decreased unmeasured anions • Decreased unmeasured cations (results in lower levels of anions in plasma) – Hypocalcemia – Hypomagnesemia – Hypokalemia – Hypoalbuminemia – Hypophosphatemia AG = Na+ - (Cl- + HCO3-) • Increased unmeasured anions – – – – – – Uremia of renal failure (H2PO4-2 and SO4-2) Ketoacidosis: diabetes mellitus, starvation (organic acids) Salicylate toxicity (salicylic acid) Methanol toxicity (formic acid) Ethylene glycol toxicity (glycolic and oxalic acids) Lactic acidosis (lactic acid) 43 Specimen Requirements • Increased unmeasured cations – – – – Hypercalcemia Hypermagnesemia Paraproteins Drugs (lithium) • Over estimation of Cl- (presence of bromides) 44 Serum or Plasma? • Serum or plasma collected by venipuncture • Capillary blood collected by fingerstick • Arterial blood collected for blood gases • Values differ slightly between these two fluids • Difference is most significant with potassium • Anticoagulant: lithium heparin or ammonium heparin • Serum K+ > plasma K+ Dependent upon platelet count: platelets rupture during clotting process • Plasma or whole blood analysis decreases turnaround time ~ POCT 45 HCO3- versus Reference Ranges Serum Normal mmol/L • • • • (adults) Sodium Potassium Chloride tCO2 136 – 145 3.4 – 5.0 98 – 107 22 – 29 46 Serum Critical mmol/L <115 <2.5 <70 <10 or or or or >160 >6.5 >120 >40 47 tCO2 • tCO2 – Directly measured on serum/heparinized plasma – Part of ‘electrolyte’ panel: Na+, K+, Cl-, tCO2 – All forms of CO2 in plasma are measured • HCO3– Predominant form of CO2 in plasma (>95%) – Often used interchangeably with tCO2 – Calculated using pH and pCO2 obtained from arterial blood gas sample pH = 6.1 + log HCO3pCO2 x 0.03 CLS 500 Application and Interpretation of Clinical Laboratory Data Electrolytes 48 8 Sources of error Sources of error • Micro clot formation due to poor mixing of sample with heparin at point of blood draw • Hemolysis: falsely increases K+ • Alcohol on skin surface not dry when blood draw performed causes hemolysis • Exposure of sample to room air (loss of CO2) • Drawing from a line that was not properly flushed • Not analyzing sample immediately after collection (cellular respirations continue, potential of bicarbonate-chloride shift) • Drawing from line and first 5cc blood not discarded 49 Sources of error 50 Good Practice • Drawing above a line • Good venipuncture technique • Drawing below a line but from the same vein as the line • Always note fluids being infused • Obtain sample from the opposite arm if patient has a line 51 52 Laboratory Results: venous Consider the following: • 15 year old female, comatose in ER • Type 1 diabetic for 7 years • Several episodes of hypoglycemia and ketoacidosis • “too busy to take insulin” 53 Sodium Potassium Chloride tCO2 Glucose BUN Creatinine TSP Albumin AST LD Lactate Osmolality CLS 500 Application and Interpretation of Clinical Laboratory Data Electrolytes 134 mmol/L (136-145) 6.0 mmol/L (3.5-5.0) 96 mmol/L (98-107) 11 mmol/L (22-29) 1050 mg/dl (FPG <100) 35 mg/dl (5-20) 1.8 mg/dl (<1.1) 6.8 g/dl (6.5-8.3) 3.3 g/dl (3.5-5.5) 45 U/L (0-50) 650 U/L (100-200) 5 mmol/L (<2.2) 385 mOsm/L (275-295) 54 9 Laboratory Results: arterial pH pO2 pCO2 7.21 85 mmHg 25 mmHg (7.35-7.45) (75-100) (35-45) HCO3- ??? mmol/L (22-26) Laboratory Results: urine Color Appearance Sp gravity pH Protein Bilirubin Urobilinogen Glucose Ketones Blood Nitrite Leuk.esterase Specimen: pH = 6.1 + log HCO3 pCO2 x 0.03 amber hazy 1.030 6.0 1+ negative 1.0 mg/dl 4+ 4+ 1+ positive 2+ catheterized 5-10 RBC/hpf 25-50 WBC/hpf 5-10 squamous epi/lpf 2-5 transitional epi/hpf 50-100 bacteria/hpf 0-2 hyaline casts/lpf Budding yeast present Mucus threads present 55 56 Laboratory Results: venous • Assess the abnormal test results for possible causes: Chemistry panel (venous) Arterial Blood Gas Urinalysis 57 Laboratory Results: venous Sodium Potassium Chloride tCO2 134 mmol/L 6.0 mmol/L 96 mmol/L 11 mmol/L Sodium Potassium Chloride tCO2 Glucose BUN Creatinine TSP Albumin AST LD Lactate Osmolality 134 mmol/L (136-145) 6.0 mmol/L (3.5-5.0) 96 mmol/L (98-107) 11 mmol/L (22-29) 1050 mg/dl (FPG <100) 35 mg/dl (5-20) 1.8 mg/dl (<1.1) 6.8 g/dl (6.5-8.3) 3.3 g/dl (3.5-5.5) 45 U/L (0-50) 650 U/L (100-200) 5 mmol/L (<2.2) 385 mOsm/L (275-295) 58 Laboratory Results: arterial (136-145) (3.5-5.0) (98-107) (22-29) pH pO2 pCO2 7.21 85 mmHg 25 mmHg (7.35-7.45) (75-100) (35-45) HCO3- ??? mmol/L (22-26) pH = 6.1 + log HCO3 pCO2 x 0.03 59 CLS 500 Application and Interpretation of Clinical Laboratory Data Electrolytes 60 10 Laboratory Results: urine Color Appearance Sp gravity pH Protein Bilirubin Urobilinogen Glucose Ketones Blood Nitrite Leuk.esterase Specimen: amber hazy 1.030 6.0 1+ negative 1.0 mg/dl 4+ 4+ 1+ positive 2+ catheterized Diagnosis: 5-10 RBC/hpf 25-50 WBC/hpf 5-10 squamous epi/lpf 2-5 transitional epi/hpf 50-100 bacteria/hpf 0-2 hyaline casts/lpf Budding yeast present Mucus threads present 61 CLS 500 Application and Interpretation of Clinical Laboratory Data Electrolytes 62 11
