Linear Transformations Worksheet: Statistics
advertisement
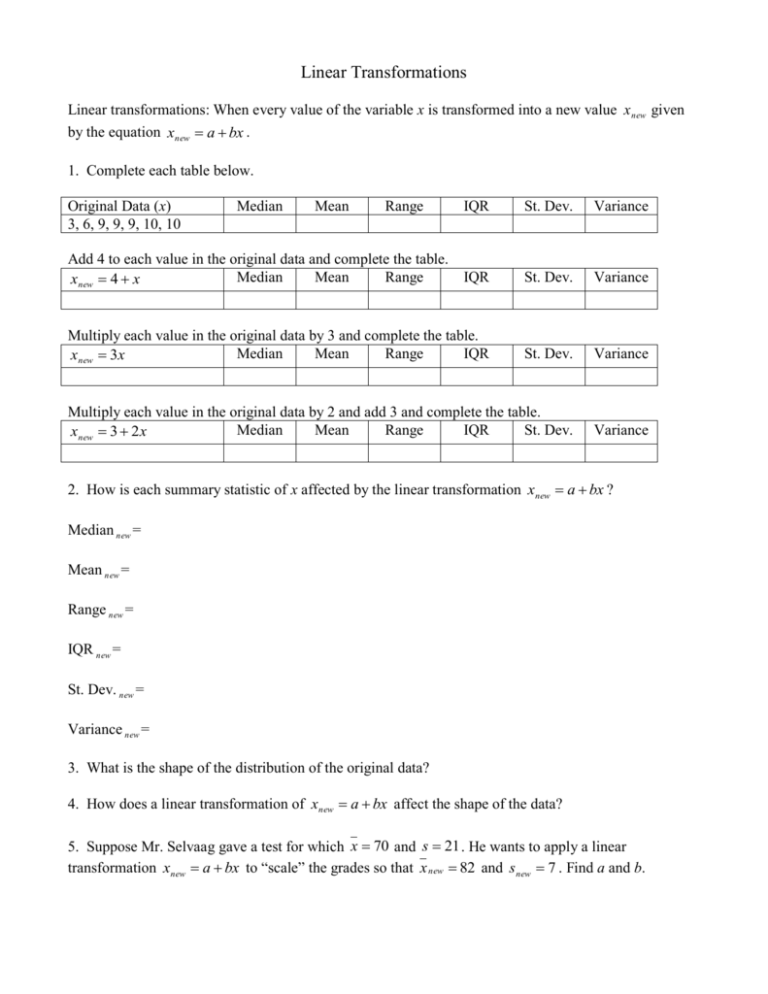
Linear Transformations Linear transformations: When every value of the variable x is transformed into a new value x new given by the equation xnew a bx . 1. Complete each table below. Original Data (x) 3, 6, 9, 9, 9, 10, 10 Median Mean Range IQR St. Dev. Variance IQR St. Dev. Variance Multiply each value in the original data by 3 and complete the table. Median Mean Range IQR xnew 3x St. Dev. Variance Multiply each value in the original data by 2 and add 3 and complete the table. Median Mean Range IQR St. Dev. xnew 3 2 x Variance Add 4 to each value in the original data and complete the table. Median Mean Range xnew 4 x 2. How is each summary statistic of x affected by the linear transformation xnew a bx ? Median new = Mean new = Range new = IQR new = St. Dev. new = Variance new = 3. What is the shape of the distribution of the original data? 4. How does a linear transformation of xnew a bx affect the shape of the data? 5. Suppose Mr. Selvaag gave a test for which x 70 and s 21 . He wants to apply a linear transformation xnew a bx to “scale” the grades so that x new 82 and s new 7 . Find a and b.
