Growth Mechanism of Amorphous Selenium Nanoparticles
advertisement
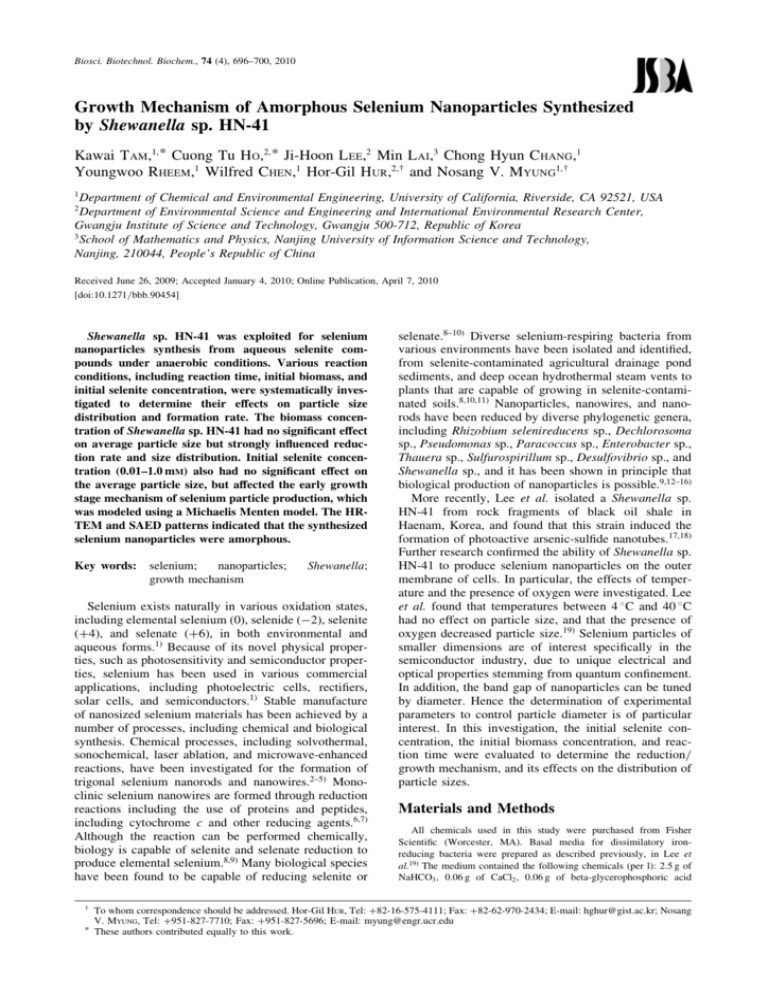
Biosci. Biotechnol. Biochem., 74 (4), 696–700, 2010 Growth Mechanism of Amorphous Selenium Nanoparticles Synthesized by Shewanella sp. HN-41 Kawai T AM,1; * Cuong Tu H O,2; * Ji-Hoon L EE,2 Min L AI,3 Chong Hyun C HANG,1 Youngwoo R HEEM,1 Wilfred C HEN,1 Hor-Gil H UR,2; y and Nosang V. M YUNG1; y 1 Department of Chemical and Environmental Engineering, University of California, Riverside, CA 92521, USA Department of Environmental Science and Engineering and International Environmental Research Center, Gwangju Institute of Science and Technology, Gwangju 500-712, Republic of Korea 3 School of Mathematics and Physics, Nanjing University of Information Science and Technology, Nanjing, 210044, People’s Republic of China 2 Received June 26, 2009; Accepted January 4, 2010; Online Publication, April 7, 2010 [doi:10.1271/bbb.90454] Shewanella sp. HN-41 was exploited for selenium nanoparticles synthesis from aqueous selenite compounds under anaerobic conditions. Various reaction conditions, including reaction time, initial biomass, and initial selenite concentration, were systematically investigated to determine their effects on particle size distribution and formation rate. The biomass concentration of Shewanella sp. HN-41 had no significant effect on average particle size but strongly influenced reduction rate and size distribution. Initial selenite concentration (0.01–1.0 mM) also had no significant effect on the average particle size, but affected the early growth stage mechanism of selenium particle production, which was modeled using a Michaelis Menten model. The HRTEM and SAED patterns indicated that the synthesized selenium nanoparticles were amorphous. Key words: selenium; nanoparticles; growth mechanism Shewanella; Selenium exists naturally in various oxidation states, including elemental selenium (0), selenide (2), selenite (þ4), and selenate (þ6), in both environmental and aqueous forms.1) Because of its novel physical properties, such as photosensitivity and semiconductor properties, selenium has been used in various commercial applications, including photoelectric cells, rectifiers, solar cells, and semiconductors.1) Stable manufacture of nanosized selenium materials has been achieved by a number of processes, including chemical and biological synthesis. Chemical processes, including solvothermal, sonochemical, laser ablation, and microwave-enhanced reactions, have been investigated for the formation of trigonal selenium nanorods and nanowires.2–5) Monoclinic selenium nanowires are formed through reduction reactions including the use of proteins and peptides, including cytochrome c and other reducing agents.6,7) Although the reaction can be performed chemically, biology is capable of selenite and selenate reduction to produce elemental selenium.8,9) Many biological species have been found to be capable of reducing selenite or y selenate.8–10) Diverse selenium-respiring bacteria from various environments have been isolated and identified, from selenite-contaminated agricultural drainage pond sediments, and deep ocean hydrothermal steam vents to plants that are capable of growing in selenite-contaminated soils.8,10,11) Nanoparticles, nanowires, and nanorods have been reduced by diverse phylogenetic genera, including Rhizobium selenireducens sp., Dechlorosoma sp., Pseudomonas sp., Paracoccus sp., Enterobacter sp., Thauera sp., Sulfurospirillum sp., Desulfovibrio sp., and Shewanella sp., and it has been shown in principle that biological production of nanoparticles is possible.9,12–16) More recently, Lee et al. isolated a Shewanella sp. HN-41 from rock fragments of black oil shale in Haenam, Korea, and found that this strain induced the formation of photoactive arsenic-sulfide nanotubes.17,18) Further research confirmed the ability of Shewanella sp. HN-41 to produce selenium nanoparticles on the outer membrane of cells. In particular, the effects of temperature and the presence of oxygen were investigated. Lee et al. found that temperatures between 4 C and 40 C had no effect on particle size, and that the presence of oxygen decreased particle size.19) Selenium particles of smaller dimensions are of interest specifically in the semiconductor industry, due to unique electrical and optical properties stemming from quantum confinement. In addition, the band gap of nanoparticles can be tuned by diameter. Hence the determination of experimental parameters to control particle diameter is of particular interest. In this investigation, the initial selenite concentration, the initial biomass concentration, and reaction time were evaluated to determine the reduction/ growth mechanism, and its effects on the distribution of particle sizes. Materials and Methods All chemicals used in this study were purchased from Fisher Scientific (Worcester, MA). Basal media for dissimilatory ironreducing bacteria were prepared as described previously, in Lee et al.19) The medium contained the following chemicals (per l): 2.5 g of NaHCO3 , 0.06 g of CaCl2 , 0.06 g of beta-glycerophosphoric acid To whom correspondence should be addressed. Hor-Gil HUR, Tel: +82-16-575-4111; Fax: +82-62-970-2434; E-mail: hghur@gist.ac.kr; Nosang V. MYUNG, Tel: +951-827-7710; Fax: +951-827-5696; E-mail: myung@engr.ucr.edu * These authors contributed equally to this work. Selenium Nanoparticles Synthesized by Shewanella sp. HN-41 disodium salt, 1 g of NH4 Cl, 0.2 g of MgCl2 .6H2 O, 0.1 g of KCl, . Results and Discussion The effects of the initial biomass concentration as measured by optical density (OD) at 600 nm and the reaction time on selenium nanoparticle size were investigated. The control experiment without addition of Shewanella sp. HN-41 did not significantly reduce the initial selenite concentration within the 72 h tested (Fig. 1A). This verified that no other reactions occurred to reduce selenite in our tests, other than that by Shewanella sp. HN-41. The capability of Shewanella sp. HN-41 to reduce selenite was tested at three different biomass concentrations at ODs of 0.02, 0.05, and 0.1. Samples were taken at time intervals of 0, 2, 6, 12, 24, and 72 h for the three OD values to determine the effects of reaction time on the selenium particles produced. At the lowest initial biomass concentration (OD 0.02) in the reactor, the selenite concentration was not reduced appreciably until 12 h. With higher biomass concentration at OD values of 0.05 and 0.1, the selenite reduction reaction was detected after 2 h and was more pronounced in the case of OD 0.1 at time intervals between 24 and 72 h. This was expected, as more Shewanella sp. HN-41 cells are present to react and reduce selenite to 0.6 A Selenite concentration (mM) 0.5 0.4 0.3 0.2 No bacteria OD=0.02 OD=0.05 OD=0.1 0.1 0.0 Average diameter (nm) of Se nanoparticles 10.0 g of NaCl, 7.2 g of HEPES (N-(2-hydroxyethyl) piperazine-N0 -2ethanesulphonic acid), 0.1 g of yeast extract, 10 ml of trace element solution, and 1 ml of vitamin solution. The medium was adjusted to pH 7.5 with 10 N NaOH. Facultative bacteria, Shewanella sp. HN-41, from a laboratory culture collection was grown on Luria–Bertani (LB) agar in an incubator at 30 C for 24 h. The cells were resuspended in sterile HEPES buffer (30 mM, pH 7.0) to achieve an optical density (OD) of 10.0 at a wavelength of 600 nm.17) Cell suspensions were inoculated into a bottle of sterile medium that contained various concentrations of sodium selenite as sole electron acceptor and 10 mM sodium lactate as sole electron donor. To achieve the desired biomass concentrations of optical densities 0.02, 0.05, and 0.10, bacteria at OD 10.0 were diluted with HEPES buffer to be inoculated into a bottled medium containing 0.01, 0.05, 0.1, 0.15, 0.25, 0.5, 0.75, or 1 mM selenite and 10 mM lactate. The inoculum volume was 1% of the total medium volume in each bottle. The cells were incubated at 30 C. Under each condition, replicate experiments were conducted. In timed-interval experiments, numerous bottles were inoculated, and replicate bottles were removed after 2, 6, 12, 24, and 72 h. The entire contents of each of the bottles were collected and centrifuged at 8;655 g for 10 min. The aqueous phase was analyzed for selenite concentration by Atomic Absorption Spectroscopy (AAS analyst 800, Perkin Elmer, Waltham, MA). The pellets were washed 5 times with deionized water, resuspended in deionized water, and dropped onto silica wafers for SEM imaging at 10 kV (SEM, XL30-FEG, Philips, Eindhoven, Netherlands). The particle size of the selenium nanospheres was measured in SEM images using imageJ software. For TEM imaging, bacteria at OD 10.0 were inoculated at 1% of the final volume of the bottled medium containing 0.5 mM selenite and 10 mM lactate. Cells were harvested after 72 h by centrifugation at 8;655 g for 10 min. The cells were washed by the method described by Oremland et al.20) They were incubated with egg white lysozyme (0.02 g in 35 ml of the complete salts solution composed of 17.5 g of NaCl, 0.74 g of KCl, 12.3 g of MgSO4 7H2 O, and 0.15 g of Tris buffer in 1 liter, and the pH was adjusted to 7.5) at 22 C for 18 h. The lysed cells were rinsed away from the selenium particles by resuspension, incubation (3 h), and sequential centrifugation (8;655 g) with the complete salts solution, 0.25 M NaOH, 0.1 M NaOH, 10 mM Na2 HPO4 (adjusted to pH 7.3), and water that was carbon-free, distilled, and deionized. The cleaned selenium particles were then resuspended in distilled and deionized water and dropped onto mesh copper grids. Images were obtained with a TEM (FEI CM300, Philips, Eindhoven, Netherlands) at 200 kV. 697 B 200 150 100 50 OD=0.02 OD=0.05 OD=0.1 0 0 20 40 60 80 Time (h) Fig. 1. Effects of Initial ODs of Shewanella sp. HN-41 on Selenite Reduction (A) and Average Selenium Nanoparticle Size (B) in Medium Containing 0.5 mM Selenite and 10 mM Lactate with Time of Incubation. selenium, resulting in faster reduction of the initial selenite concentration over the 72 h tested. Figure 1B shows the effect of the biomass concentration on nanoparticles size of selenium, which was obtained measuring from 52 to 121 particles, depending on availability, at each time interval. Based on SEM images of the selenium nanoparticles (Fig. 2), the average particle diameter and the size distribution were determined. The average diameter of the selenium nanoparticles was not significantly affected by increases in the biomass concentration throughout the 72-h period, but the distribution of the particle sizes was greatly affected by the biomass concentration and by the reaction time. This is illustrated in Fig. 3, which includes both histograms and modified Gaussian trendlines. The frequency of the particle size shifted from smaller particles to larger ones as the reaction progressed. The abscissa values represent particle size ranges. For example, the first vertical bar of the histogram denotes a particle diameter range of 1– 10 nm; the second bar denotes particles of 11–20 nm, and so on. At a lower biomass concentration such as OD 0.02, the majority of the selenium particles were 1– 20 nm in diameter after 2 h (Fig. 3A). Six h into the reaction, the selenium particle size shifted to a peak in the 11–20 nm range (Fig. 3B). The selenium particles continued to grow in crystalline structure as the reaction continued and the distribution became broader with a larger standard deviation as distinguished by a normal Gaussian plot that was more bell-shaped (Fig. 3C and D). Similarly, at OD 0.05, a sharp peak in selenium particle sizes of 11–20 nm was detected early on after 698 K. TAM et al. 6 h of incubation 2 h of incubation 500 nm 12 h of incubation 500 nm 500 nm 24 h of incubation 500 nm Fig. 2. SEM Images of Se Nanoparticles Formed by Initial OD 0.1 of Shewanella sp. HN-41 in Medium Containing 0.5 mM Selenite and 10 mM Lactate with Different Reaction Times. 2 h (Fig. 3E) with a secondary widely distributed plateau with approximately 6% frequency. After 6 h, a better defined bimodal Gaussian distribution occurred, the selenium particles grew progressively, and the frequency of selenium particles of 11–20 nm decreased and shifted to a peak particle diameter of 51–60 nm (Fig. 3F). Thereafter, similarly to the OD 0.02 case after 12 h, the selenium particle sizes became distributed more in the Gaussian mode (Fig. 3G and H). The bimodal nature of the selenium particle size distribution became more prevalent as a higher initial biomass concentration was used. In Fig. 3I, at OD 0.1 after 2 h, a more prominent bimodal distribution of the selenium particles was observed, with a peak at 1–10 nm and a secondary indented flat peak between selenium particle sizes of 31– 70 nm. Comparing the OD 0.05 to the OD 0.1 case, as the frequency of the smaller selenium particle size range decreased, the selenium particles shifted to the secondary peak particle size range. It is expected that facultative anaerobic Shewanella sp. HN-41 employs selenite as a sole electron acceptor for growth in these anaerobic experiments.19) As suggested by the initial formation of Se (0) particles on the outer membrane of the cells,16,19) the reaction probably occurred as the result of respiratory electron transfer to Se (IV).21) In addition, it is possible that selenium nanospheres can also be formed by various bacterial soluble selenite reductases.22,23) Thus the lower the biomass concentration, the fewer cells were presented to reduce the selenite in the solution. The smaller selenium particles formed acted as nuclei and grew into larger selenium nanoparticles. These results indicate that lower biomass concentrations had fewer enzymatic reactions, so that particle development was more consistent. More uniform development of seed nuclei to larger crystal structures at the early stages of selenium development occurred. With greater biomass concentration, more selenite reduction reactions occurred, and the rate-limiting step no longer depended on the biomass concentration. The selenium particles became welldistributed in a Gaussian distribution for all the biomass concentrations tested after a 12-h reaction period (Fig. 3C, D, G, H, K, and L), regardless of the initial biomass concentration. These results indicate that the particle size distribution of selenium nanoparticles was affected by both the initial biomass concentration and the reaction time. Experiments with initial selenite concentrations of 0.01, 0.05, 0.1, 0.15, 0.25, 0.5, 0.75, and 1 mM were evaluated to determine the effect of the initial substrate concentration on the average selenium particle size as well. The culture medium contained OD 0.1 of Shewanella sp. HN-41, 10 mM lactate, and selenite concentration to be investigated, and it was incubated at 30 C for a 12-h reaction period. As seen in Fig. 4, the resulting plot demonstrated that the initial selenite concentration did not have a significant effect on the average selenium particle size within the standard deviations after a 12-h incubation period. The average selenium particle size in Fig. 4 was approximately 103 5:1 nm for all the initial selenite concentrations tested. Coupled with the trends seen in Figs. 1B and 4, it appeared that reaction time rather than changes in initial selenite or initial biomass concentration determined the average selenium nanoparticle size. Hence the kinetics of selenite reduction was further investigated. In another set of experiments, initial selenite concentrations of 0.01, 0.05, 0.1, 0.25, 0.5, 0.75, and 1.0 mM were incubated in the culture medium of Shewanella sp. HN-41 (OD 0.1) containing 10 mM lactate at 30 C for 72 h to ensure completion of selenite reduction. In Fig. 5, a plot of the quantity of selenite reduced by Shewanella sp. HN-41 as measured by changes in the selenite concentration at various initial selenite concentrations appears. The plot was similar to what would be expected of an enzyme-catalyzed reaction. Per unit time, a maximum selenite reduction concentration (plateau) of approximately 0:08 0:01 mM was observed (Fig. 5), illustrating that an initial selenite concentration of no greater than 0.1 mM is required to achieve maximum selenium nanoparticle production by Shewanella sp. HN-41 under the conditions tested. The results of these biological experiments were modeled using a Michaelis Menten relationship, assuming that the lactate concentration is non-limiting based on experiments conducted by other researchers on Shewanella sp.24) By methods described in Bailey and Selenium Nanoparticles Synthesized by Shewanella sp. HN-41 50 50 A OD = 0.02 (2 h) N = 52 35 ± 45 nm Frequency (%) 40 40 50 C OD = 0.02 (12 h) N = 97 86 ± 22 nm 40 30 30 20 20 20 20 10 10 10 10 50 100 150 50 OD = 0.05 (2 h) N = 70 33 ± 29 nm E 40 0 200 0 50 0 50 100 150 200 OD = 0.05 (6 h) N = 64 63 ± 35 nm F 50 100 150 200 0 OD = 0.05 (12 h) N = 73 105 ± 19 nm G 40 30 30 20 20 20 20 10 10 10 10 0 50 100 150 50 200 0 0 50 100 150 50 OD = 0.1 (2 h) N = 70 41 ± 30 nm I 40 200 OD = 0.1 (6 h) N = 91 79 ± 23 nm J 50 100 150 200 0 OD = 0.1 (12 h) N = 74 92 ± 18 nm K 40 30 20 20 20 20 10 10 10 10 0 100 150 200 0 0 Particle diameter (nm) 50 100 150 200 100 150 200 OD = 0.1 (24 h) N = 121 116 ± 26 nm L 30 50 50 40 30 0 200 50 30 0 150 0 0 50 40 100 OD = 0.05 (24 h) N = 71 123 ± 21 nm H 40 30 0 50 50 30 0 OD = 0.02 (24 h) N = 74 121 ± 18 nm 0 0 50 40 D 40 30 0 Frequency (%) OD = 0.02 (6 h) N = 54 46 ± 46 nm 30 0 Frequency (%) 50 B 699 0 0 Particle diameter (nm) 50 100 150 200 0 50 100 150 200 Particle diameter (nm) Particle diameter (nm) Fig. 3. Effects of Initial OD of Shewanella sp. HN-41 and Incubation Time on Selenium Nanoparticle Size Distributions in Medium Containing 0.5 mM Selenite and 10 mM Lactate. N is number of the selenium nanoparticles counted. 0.10 120 ∆Selenite concentration (mM) Average diameter (nm) of Se nanoparticles 140 100 80 60 40 0.08 0.06 0.04 0.02 20 0 0.00 0.0 0.2 0.4 0.6 0.8 1.0 Initial selenite concentration (mM) Fig. 4. Effects of Initial Selenite Concentration on Average Selenium Nanoparticle Size Formed by Initial OD 0.1 of Shewanella sp. HN41 for 12 h. Ollis, a model expressing the rate of change in the selenite concentration (ds=dt) with respect to the selenite concentration (s) with a velocity constant (vmax ) and a saturation constant known as the Michaelis constant (Km ), is shown in equation (1).25) A high degree of correlation to the experimental data was achieved with a coefficient of correlation (R2 ) value of 0.99. 0.0 0.2 0.4 0.6 0.8 1.0 Initial selenite concentration (mM) Fig. 5. Effects of Initial Selenite Concentration on Amount of Reduced Selenite at Initial OD 0.1 of Shewanella sp. HN-41 after 72 h of Incubation. ds vmax s 1:37s ¼ ¼ dt Km þ s 88:0 þ s ðR2 ¼ 0:99Þ ð1Þ The values of vmax and Km were 1.37 mM h1 and 88.0 mM respectively. As illustrated by the model, and consistently with the results in Fig. 4, a selenite concentration of 88.0 mM or approximately 0.1 mM (condition tested) results in a stable reduction of selenite (at ds=dt ¼ 0). 700 K. TAM et al. A B 100 nm C 10 nm Fig. 6. HR-TEM (A), TEM (B), and Selected Area Electron Diffraction (SAED) Patterns (C) of Synthesized Selenium Nanoparticles. Higher initial selenite concentrations do not appreciably improve the rate of selenium nanoparticle production. The crystal structure and morphology of synthesized selenium nanoparticles were examined by high-resolution transmission electron microscopy (HR-TEM) with selected area electron diffraction patterns (SAED) which indicates that the synthesized selenium nanoparticles were amorphous (Fig. 6). In conclusion, selenium nanoparticles were biologically synthesized from aqueous selenite using Shewanella sp. HN-41 under anaerobic conditions. The effects of reaction conditions such as reaction time, initial biomass, and initial selenite concentration on the reaction rate, average selenium particle size, and size distribution were systematically investigated. Although the average selenium particle size was unaffected by the initial biomass concentration, the reduction rate and selenium particle size distribution were significantly governed by the biomass concentration. Selenium nanoparticles of 1–20 nm were achievable at a low initial biomass concentration (OD 0.02) at shorter reaction time (e.g., 2 h). The initial selenium concentrations (0.01–1.0 mM) had no significant effect on the average selenium particle size, but affected the early-stage kinetics of selenium nanoparticle production, which were modeled using a Michaelis Menten model in which a stable reduction of selenite was achieved at 0.1 mM. The HRTEM and SAED patterns indicated that the synthesized selenium nanoparticles were amorphous. 3) 4) 5) 6) 7) 8) 9) 10) 11) 12) 13) 14) 15) 16) 17) 18) 19) Acknowledgments 20) This work was supported by the 21C Frontier Microbial Genomics and Applications Center Program (M102KK010011-08K1101-01110) of the Ministry of Education, Science and Technology of the Republic of Korea. 21) 22) 23) 24) References 25) 1) 2) Barceloux DG, J. Toxicol. Clin. Toxicol., 37, 145–172 (1999). Li Q, Ding Y, Li FQ, Xie B, and Qian YT, J. Cryst. Growth, 236, 357–362 (2002). Gedanken A, Ultrason. Sonochem., 11, 47–55 (2004). Jiang ZY, Xie ZX, Xie SY, Zhang XH, Huang RB, and Zheng LS, Chem. Phys. Lett., 368, 425–429 (2003). Lu QY, Gao F, and Komarneni S, J. Mater. Res., 19, 1649–1655 (2004). Abdelouas A, Gong WL, Lutze W, Shelnutt JA, Franco R, and Moura I, Chem. Mater., 12, 1510–1512 (2000). Gao XY, Gao T, and Zhang LD, J. Mater. Chem., 13, 6–8 (2003). Dungan RS, Yates SR, and Frankenberger WT, Environ. Microbiol., 5, 287–295 (2003). Hunter WJ, Curr. Microbiol., 54, 376–381 (2007). Rathgeber C, Yurkova N, Stackebrandt E, Beatty JT, and Yurkov V, Appl. Environ. Microbiol., 68, 4613-4622 (2002). Di Gregorio S, Lampis S, and Vallini G, Environ. Int., 31, 233– 241 (2005). Morita M, Uemoto H, and Watanabe A, Eng. Life Sci., 7, 235– 240 (2007). Zhang YQ, Zahir ZA, Amrhein C, Chang A, and Frankenberger WT, J. Agric. Food Chem., 55, 5714–5717 (2007). Demolldecker H and Macy JM, Arch. Microbiol., 160, 241–247 (1993). Oremland RS, Blum JS, Bindi AB, Dowdle PR, Herbel M, and Stolz JF, Appl. Environ. Microbiol., 65, 4385–4392 (1999). Klonowska A, Heulin T, and Vermeglio A, Appl. Environ. Microbiol., 71, 5607–5609 (2005). Lee JH, Roh Y, Kim KW, and Hur HG, Geomicrobiol. J., 24, 31–41 (2007). Lee JH, Kim MG, Yoo B, Myung NV, Maeng J, Lee T, Dohnalkova AC, Fredrickson JK, Sadowsky MJ, and Hur HG, Proc. Natl. Acad. Sci. USA, 104, 20410–20415 (2007). Lee JH, Han J, Choi H, and Hur HG, Chemosphere, 68, 1898– 1905 (2007). Oremland RS, Herbel MJ, Blum JS, Langley S, Beveridge TJ, Ajayan PM, Sutto T, Ellis AV, and Curran S, Appl. Environ. Microbiol., 70, 52–60 (2004). Blum JS, Bindi AB, Buzzelli J, Stolz JF, and Oremland RS, Arch. Microbiol., 171, 19–30 (1998). Yanke LJ, Bryant RD, and Laishley EJ, Anaerobe, 1, 61–67 (1995). Pierru B, Grosse S, Pignol D, and Sabaty M, Appl. Environ. Microbiol., 72, 3147–3153 (2006). Liu CX, Gorby YA, Zachara JM, Fredrickson JK, and Brown CF, Biotechnol. Bioeng., 80, 637–649 (2002). Bailey JE and Ollis DF, ‘‘Biochemical Engineering Fundamentals’’ 2nd ed., McGraw-Hill Science/Engineering/Math, New York (1986).
