CP5605/CP3300: Knowledge Discovery and Data Mining
advertisement
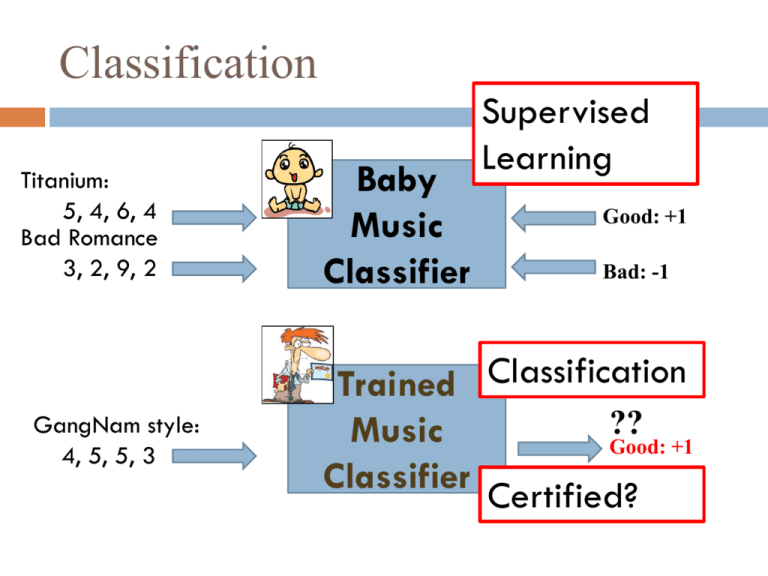
Classification Titanium: 5, 4, 6, 4 Bad Romance 3, 2, 9, 2 GangNam style: 4, 5, 5, 3 Baby Music Classifier Supervised Learning Good: +1 Bad: -1 Trained Classification ?? Music Good: +1 Classifier Certified? How good is the music classifier? Made a total of 6 classifications 4 are classified as Pos (Good) Out of the 4, only 3 are actually Pos 2 are classified as Neg (Bad) Out of the 2, only 1 is actually Neg Classified (Predicted) P N Trained Music Classifier Actual P N 3 TP 1 FP 4 1 FP 1 TN 2 Contingency Table How good is the music classifier? Made a total of 6 classifications 4 are classified as Pos (Good) Out of the 4, only 3 are actually Pos 2 are classified as Neg (Bad) Out of the 2, only 1 is actually Neg = 1- Accuracy = 1 – 0.67 = 23% = # of correct Pos predictions / # of total Pos predictions = ?? Recall (sensitivity): % of correct predictions among Pos cases = # of correct predictions / # of total predictions = (3 + 1) / 6 = 4/6 = 67% Precision: % of correct predictions among Pos predictions 3 TP 1 FP 4 Error Rate P N Accuracy: % of correct predictions P = # of correct Pos predictions / # of total Pos cases = ?? Specificity: % of Neg correct predictions among Neg cases = # of correct Neg predictions / # of total Neg cases = ?? N 1 FP 1 TN 2 Quizz Accuracy? = (1+4)/(1+2+3+4) = 5/10 Error Rate? Precision? = 1/(1+3) = 1/4 = 25% Recall? =1/(1+2) Predicted class = 1/3 = 33.3% Specificity? = 4/(3+4) = 4/7 = 57.1% Assigned class + - + - 1 2 3 4 Contingency table (2X2) Contingency table: Square = Pos cases 5 Predict N Predict P Classified class Yes No Yes TP FN No FP TN Original class Contingency table (2X2) POS = 14 NEG = 13 TP= TN= Recall = Sensitivity = Specificity = Precision = TP rate = FP rate = Contingency table 6 Classified class Yes No Yes TP FN No FP TN Original class Contingency table (2X2) • • • • • • • • • • POS cases = 14 NEG cases = 13 TP= TN= Recall = Sensitivity = Specificity = Precision = TP rate = FP rate = ROC Curves (6.15.2) 7 Vertical axis represents the true positive rate Horizontal axis rep. the false positive rate The plot also shows a diagonal line A model with perfect accuracy will have an area of 1.0 Data Partition Hold-out: Split Dataset into 3 parts, use 2 for training and one for testing. Z1 Z2 Z3 Classifier D Resubstitution Result Training data size is reduced to 66% Data Partition Cross-validation: Training data |Z – Zi| is greater than 66% Data Z = Z1, Z2 ,….,ZK Data Z – Z1 Data Z1 Cross validation Result 1 Classifier D Data Zk Data Z - Zk Classifier D Cross validation Result K Data Partition Leave-one-out = Cross-validation where |Zi| = 1, K = |Z| 100% of data used for training Data Z = Z1, Z2 ,….,ZK Data Z – Z1 Data Z1 Cross validation Result 1 Classifier D Data Zk Data Z - Zk Classifier D Cross validation Result K Data Partition: Bootstrap dataset 36.8% … Training data Test data train test 36.8% 36.8% … evaluate statistics for each iteration and then compute the average Classification Procedure Name Am Em F Label Titanium 5 4 6 Good Bad Romance 3 7 6 Bad Umbrella 1 2 2 Good Superstition 3 7 3 Bad Respect 6 6 4 Good Blue Monday 2 3 9 Good Ray Of Light 4 2 8 Bad Divide the dataset Test data Training data Building a classifier + - + - 1 2 3 4 Validating the classifier K-NN The k-Nearest Neighbor Algorithm Count Neighbors of Xq. How many + (rich)? How many – (poor)? Is Xq rich or poor? _ _ _ _ + + _ .x + q _ + K-NN The k-Nearest Neighbor Algorithm Measure distance to the nearest Neighbor of Xq. Is Xq rich or poor? Equidistance line ..Voronoi diagram .Xq .+ .+ Eager Learning 1R Classification There are N attributes: A1, A2, A3, A4,…., AN 3 classes: Good, OK, Bad 30 training music A3=Cm 3 values: [< 5], <5 Good 7 Good, 3 others 5< and <10 [5< and <10], [>10] >10 OK Bad 6 OK, 4 others 5 Bad, 5 others Error rate = (3+4+5)/30 = 12/30 = 40% How to choose the best attribute that minimizes the error rate? Pseudo-code for 1R 1. 2. 3. 4. 5. 6. 7. For each attribute A: For each value V of the attribute A: C = the most frequent class having value V of A Make rule: if A = V, then C error_A += # of samples with A=V and not C Total_error_rate_A = error_A / # of samples Return rule with the minimum total error rate Note: “missing” is treated as a separate attribute value A3 V1 If A3 = V1, then C1 16 C1 V2 C2 If A3 = V2, then C2 age? True Eager Learning Decision tree <=30 30..40 >40 student? yes credit rating? no yes excellent fair no How to choose the best attribute? no yes 1R strategy does not work, too many possible combinations About 648 possible trees yes True Eager Learning Decision tree The best decision tree algorithm is still unknown! 100= 50P + 50N But, we have some good Choose Best attribute A3 ones: ID3 developed by Ross Quinlan. Y 1. Select the best attribute 45= 25P + 20N using information gain A2 measure Choose Best attribute 2. Construct a sub tree 3. For each branch, go to 1 until no more cases are left N 55= 30P + 25N A4 Information Gain Assume Two classes: Pos (Yes) and Neg (No) Shannon’s Information measure: p p n n I ( p, n) log 2 log 2 pn pn pn pn Before we know the value of Age: I(9,5) = – 9/14 Log2(9/14) – 5/14 Log2(5/14) After we know the value of age? IAge = (5/14) I(3,2) + (4/14) I(4,0) + (5/14) I(3,2) Gain = I(9,5) – IAge 14 samples: 9P, 5N age <= 30 31..40 > 40 No Yes Yes No Yes Yes No Yes No Yes Yes Yes Yes 3P, 2N 4P No 3P, 2N Extracting Classification Rules from Trees Represent the knowledge in the form of IF-THEN rules One rule is created for each path from the root to a leaf Each attribute-value pair along a path forms a conjunction The leaf node holds the class prediction age? <=30 31..40 >40 student? yes credit rating? no yes excellent fair no yes no yes If age <= 30 AND student=No, then NO Extracting Classification Rules from Trees age? <=30 30..40 >40 student? yes credit rating? no yes excellent fair no yes no yes Example IF age = “<=30” AND student = “no” THEN buys_computer = “no” IF age = “<=30” AND student = “yes” THEN buys_computer = “yes” IF age = “31…40” THEN buys_computer = “yes” IF age = “>40” AND credit_rating = “excellent” THEN buys_computer = “yes” IF age = “>40” AND credit_rating = “fair” THEN buys_computer = “no” Avoid Overfitting in Classification Overfitting: Classifiers are working well with the training data, but are not with the test data. That is, classifiers are too much learned from the training data. The generated tree may overfit the training data Too many branches, some may reflect anomalies due to noise or outliers Result is in poor accuracy for unseen samples Two approaches to avoid overfitting Prepruning: Halt tree construction early Postpruning: Remove branches from a “fully grown” tree Enhancements to Basic Decision Tree Induction 23 Allow for continuous-valued attributes Dynamically define new discrete-valued attributes that partition the continuous attribute value into a discrete set of intervals Handle missing attribute values Assign the most common value of the attribute Assign probability to each of the possible values Attribute construction Create new attributes based on existing ones that are sparsely represented This reduces fragmentation, repetition, and replication Classification in Large Databases 24 Classification—a classical problem extensively studied by statisticians and machine learning researchers Scalability: Classifying data sets with millions of examples and hundreds of attributes with reasonable speed Why decision tree induction in data mining? relatively faster learning speed (than other classification methods) convertible to simple and easy to understand classification rules can use SQL queries for accessing databases comparable classification accuracy with other methods
