1. What is Macroeconomics 2. Macroeconomic Goals 3. Economic
advertisement
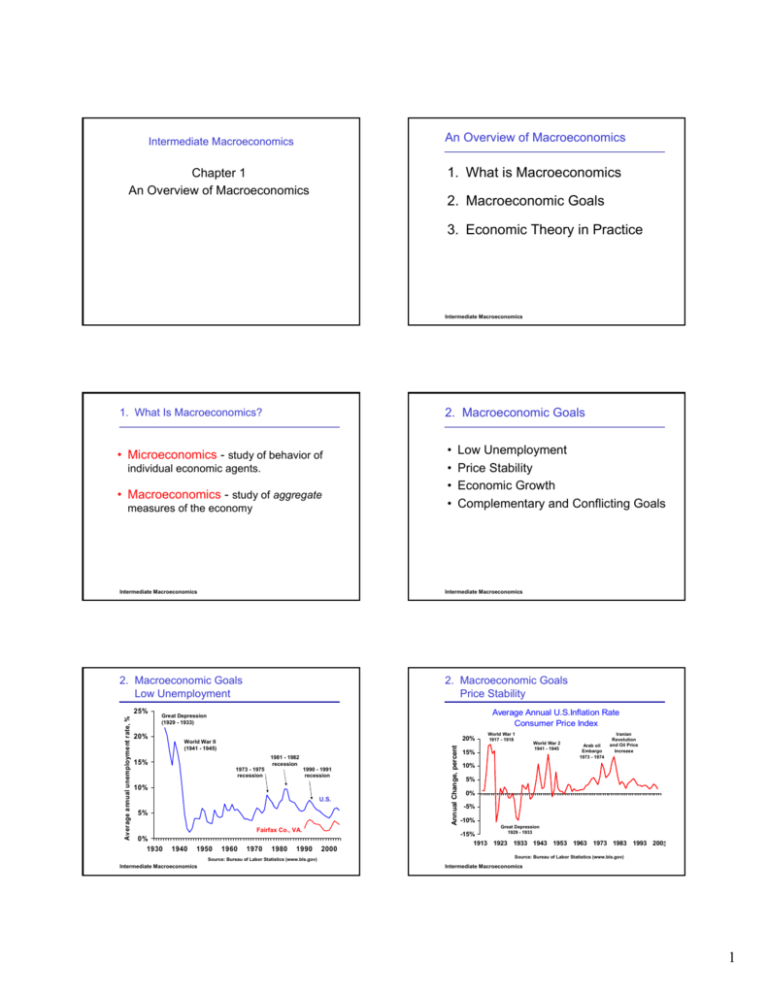
Intermediate Macroeconomics An Overview of Macroeconomics Chapter 1 An Overview of Macroeconomics 1. What is Macroeconomics 2. Macroeconomic Goals 3. Economic Theory in Practice Intermediate Macroeconomics 1. What Is Macroeconomics? 2. Macroeconomic Goals • Microeconomics - study of behavior of • • • • individual economic agents. • Macroeconomics - study of aggregate measures of the economy Low Unemployment Price Stability Economic Growth Complementary and Conflicting Goals Intermediate Macroeconomics Intermediate Macroeconomics 2. Macroeconomic Goals Low Unemployment 2. Macroeconomic Goals Price Stability Average Annual U.S.Inflation Rate Consumer Price Index Great Depression (1929 - 1933) 20% 20% World War II (1941 - 1945) 1981 - 1982 recession 15% 1990 - 1991 recession 1973 - 1975 recession 10% U.S. 5% Fairfax Co., VA. 0% 1930 1940 1950 1960 1970 1980 1990 Source: Bureau of Labor Statistics (www.bls.gov) Intermediate Macroeconomics 2000 Annual Change, percent Average annual unemployment rate, % 25% World War 1 1917 - 1918 15% World War 2 1941 - 1945 Arab oil Embargo 1973 - 1974 Iranian Revolution and Oil Price Increase 10% 5% 0% -5% -10% Great Depression 1929 - 1933 -15% 1913 1923 1933 1943 1953 1963 1973 1983 1993 2003 Source: Bureau of Labor Statistics (www.bls.gov) Intermediate Macroeconomics 1 2. Macroeconomic Goals Economic Growth 2. Macroeconomic Goals Economic Growth Annual change in U.S. GDP per capita $40,000 0.2 Nominal GDP 0.1 0 Real GDP (chained 1996 dollars) -0.1 -0.2 -0.3 1930 Real GDP per capita chained (1996) dollars Percent annual change 0.3 $30,000 $20,000 $10,000 Long term trend 2.4% per year $0 1940 1950 1960 1970 1980 1990 2000 1930 1940 1950 1960 1970 1980 1990 2000 Source: Bureau of Economic Analysis (www.bea.gov) Intermediate Macroeconomics Intermediate Macroeconomics 2. Macroeconomic Goals Complementary and Conflicting Goals 3. Economic Theory in Practice • Complementary Goals • Economic Theory and Models – Low unemployment and high economic growth • Empirical Applications • Conflicting Goals – Low unemployment and low inflation Intermediate Macroeconomics Intermediate Macroeconomics 3. Economic Theory in Practice Economic theory and models 3. Economic Theory in Practice Economic theory and models What makes a good model? Keep models simple • Accurately explains history • Occam’s Razor - eliminate • Makes reasonable predictions about the future complicating details that don’t significantly contribute to the model • Ceteris Paribus - other things being equal Intermediate Macroeconomics Intermediate Macroeconomics 2 3. Economic Theory in Practice Empirical time series applications 3. Economic Theory in Practice Compare real rather than nominal • Use Real rather than Nominal values Percent increase 1929 – 2003 Nominal GDP: 10,522 % Real GDP: 1,100 % $12,000 $10,000 Chained 2000 dollars • Compare Per Capita rather than Totals • Compare Growth Rates rather than Levels $8,000 $6,000 Real GDP $4,000 Nominal GDP $2,000 $0 1929 1939 1949 1959 1969 1979 1989 1999 Source: Bureau of Economic Analysis, www.bea.gov Intermediate Macroeconomics Intermediate Macroeconomics 3. Economic Theory in Practice Compare per capita rather than aggregates 3. Economic Theory in Practice Compare growth rates rather than levels Percent increase 1929 – 2003 Total Real GDP: 1,100 % Real GDP per capita: 402% $40,000 $30,000 Real GDP per capita $20,000 $20,000 Total Real GDP $10,000 $10,000 Annual growth real GDP per capita $30,000 5% billions of chained 2000 dollars Per capita chained 2000 dollars $40,000 4.1% 4% 2.9% 3% 2.1% 2.0% 2.3% 2.0% 1.7% 2% 1% 0% $0 1929 $0 1939 1949 1959 1969 1979 1989 1999 Source: Bureau of Economic Analysis, www.bea.gov Intermediate Macroeconomics 19301940 19401950 19501960 19601970 19701980 19801990 19902000 Source: Bureau of Economic Analysis, www.bea.gov Intermediate Macroeconomics 3
