KIN 4310 and HLT 4307 Lab 2 Lab Title: Estimating VO2max
advertisement
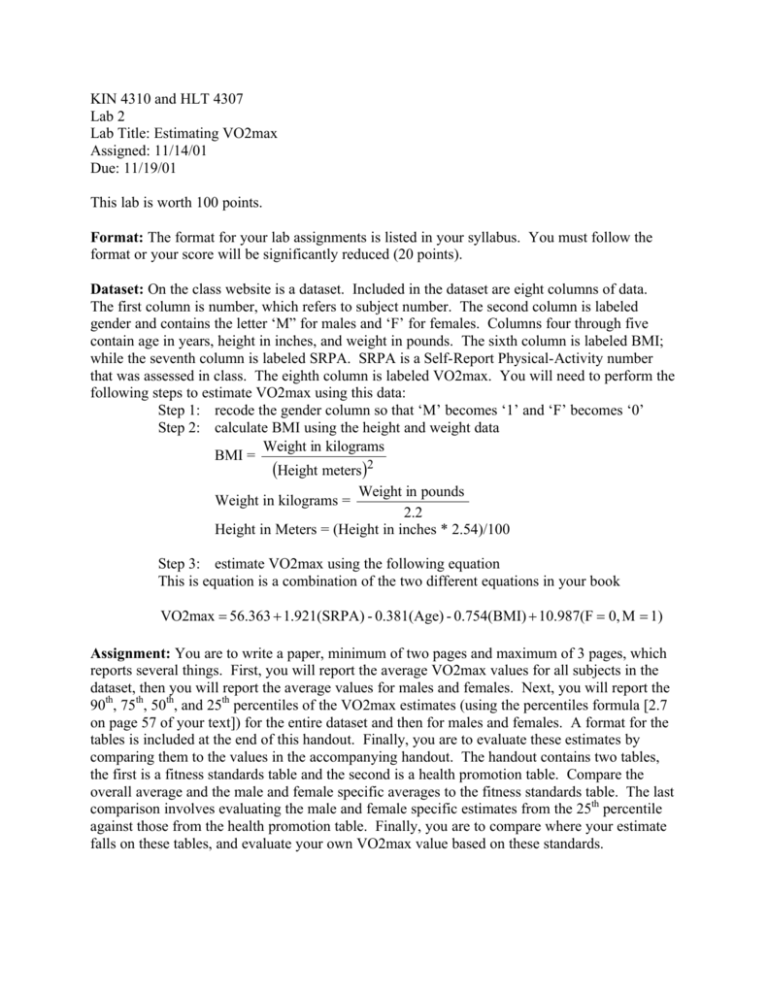
KIN 4310 and HLT 4307 Lab 2 Lab Title: Estimating VO2max Assigned: 11/14/01 Due: 11/19/01 This lab is worth 100 points. Format: The format for your lab assignments is listed in your syllabus. You must follow the format or your score will be significantly reduced (20 points). Dataset: On the class website is a dataset. Included in the dataset are eight columns of data. The first column is number, which refers to subject number. The second column is labeled gender and contains the letter ‘M” for males and ‘F’ for females. Columns four through five contain age in years, height in inches, and weight in pounds. The sixth column is labeled BMI; while the seventh column is labeled SRPA. SRPA is a Self-Report Physical-Activity number that was assessed in class. The eighth column is labeled VO2max. You will need to perform the following steps to estimate VO2max using this data: Step 1: recode the gender column so that ‘M’ becomes ‘1’ and ‘F’ becomes ‘0’ Step 2: calculate BMI using the height and weight data Weight in kilograms BMI = (Height meters)2 Weight in pounds Weight in kilograms = 2.2 Height in Meters = (Height in inches * 2.54)/100 Step 3: estimate VO2max using the following equation This is equation is a combination of the two different equations in your book VO2max = 56.363 + 1.921(SRPA) - 0.381(Age) - 0.754(BMI) + 10.987(F = 0, M = 1) Assignment: You are to write a paper, minimum of two pages and maximum of 3 pages, which reports several things. First, you will report the average VO2max values for all subjects in the dataset, then you will report the average values for males and females. Next, you will report the 90th, 75th, 50th, and 25th percentiles of the VO2max estimates (using the percentiles formula [2.7 on page 57 of your text]) for the entire dataset and then for males and females. A format for the tables is included at the end of this handout. Finally, you are to evaluate these estimates by comparing them to the values in the accompanying handout. The handout contains two tables, the first is a fitness standards table and the second is a health promotion table. Compare the overall average and the male and female specific averages to the fitness standards table. The last comparison involves evaluating the male and female specific estimates from the 25th percentile against those from the health promotion table. Finally, you are to compare where your estimate falls on these tables, and evaluate your own VO2max value based on these standards. Paper: Your paper should have four different sections: introduction; methods; results and conclusions. The introduction section should introduce me to the topic of your paper and why it should be done (why should you be estimating VO2max and what important information can you obtain?). This section should be three to four sentences long (the very first sentence should start: “The purpose of this paper is to estimate VO2max for male and female college students and to develop percentiles for comparison against published norms”). The methods section should inform me of how VO2max was estimated (state that you used a non-exercise equation and that it incorporated BMI, not percent body fat). You should also include the equation. This section should be four to five sentences long. The results section should report the mean (+ s) VO2max values for the entire dataset, males and females, and the various percentile estimates. This information should be reported in the tables and the text. The conclusions section should be an overall wrap-up of the paper. Included in this section should be what you think should be stated about the validity of the VO2max estimates (from the lecture, notes and textbook). Then you need to state how the average, and the male and female specific averages, compares to the fitness standards table. Next you will need to state how the 25th percentile values, all and male and female specific, compare to the health promotion standards. Table 1. Descriptive statistics for VO2max estimates. Parameter Mean Standard Deviation All Subjects Males Females Table 2. Percentiles for VO2max estimates. Percentile All Subjects Males 90th 75th 50th 25th Females Minimum Maximum
