Accommodation statistics
advertisement
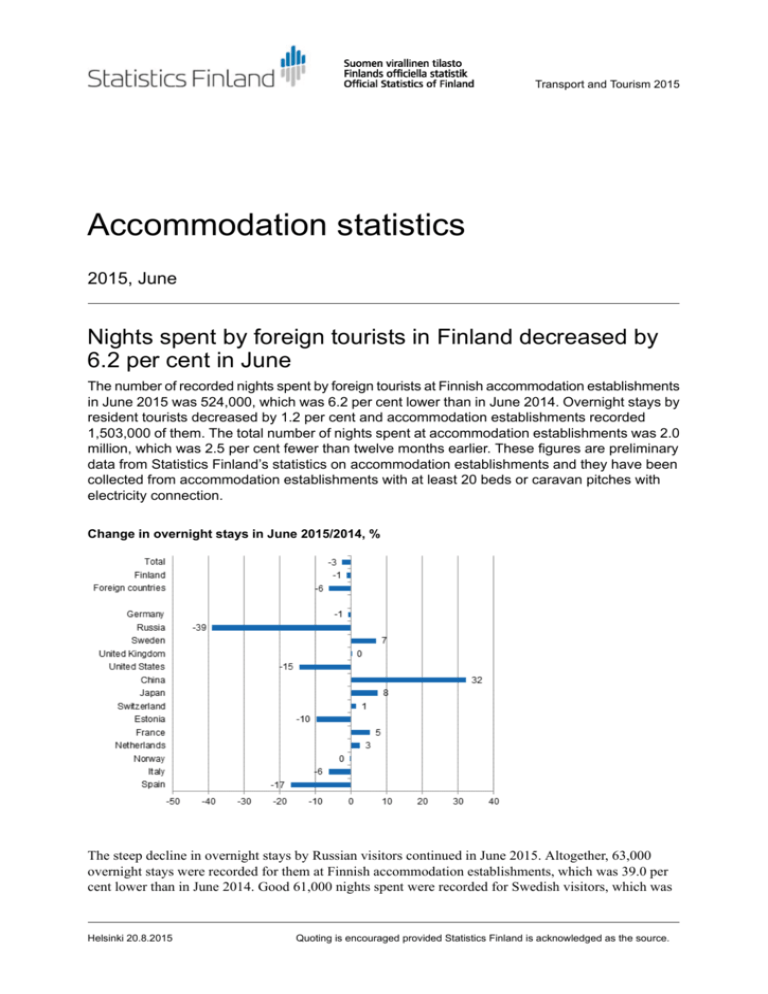
Transport and Tourism 2015 Accommodation statistics 2015, June Nights spent by foreign tourists in Finland decreased by 6.2 per cent in June The number of recorded nights spent by foreign tourists at Finnish accommodation establishments in June 2015 was 524,000, which was 6.2 per cent lower than in June 2014. Overnight stays by resident tourists decreased by 1.2 per cent and accommodation establishments recorded 1,503,000 of them. The total number of nights spent at accommodation establishments was 2.0 million, which was 2.5 per cent fewer than twelve months earlier. These figures are preliminary data from Statistics Finland’s statistics on accommodation establishments and they have been collected from accommodation establishments with at least 20 beds or caravan pitches with electricity connection. Change in overnight stays in June 2015/2014, % The steep decline in overnight stays by Russian visitors continued in June 2015. Altogether, 63,000 overnight stays were recorded for them at Finnish accommodation establishments, which was 39.0 per cent lower than in June 2014. Good 61,000 nights spent were recorded for Swedish visitors, which was Helsinki 20.8.2015 Quoting is encouraged provided Statistics Finland is acknowledged as the source. 7.1 per cent more than twelve months earlier. Russians were the second largest and Swedes the third largest group of foreign tourists in June. German tourists were the biggest group of tourists and they had 69,000 overnight stays at accommodation establishments, which was 0.8 per cent lower than in June 2014. British visitors came next with close on 29,000 nights spent, with a slight increase of 0.2 per cent from the previous year. A total of 28,000 overnight stays were recorded for visitors from the United States, and the drop from June 2014 amounted to 14.5 per cent. The recorded number of overnight stays for Chinese visitors was 25,000. Among the biggest countries of inbound tourism to Finland, the biggest growth in overnight stays was recorded for Chinese visitors; 32.4 per cent. By region, the total number of overnight stays increased in June most in Åland, up by 17.7 per cent. The number of overnight stays grew by 14.0 per cent in South Ostrobothnia and by 12.3 per cent in Ostrobothnia. The biggest decreases in overnight stays were recorded in Central Ostrobothnia, 16.9 per cent, and in North Ostrobothnia, 14.8 per cent. In the whole country, overnight stays decreased by 2.5 per cent from the corresponding period last year. Change in overnight stays in June by region 2015 / 2014, % Slightly fewer nights were spent at hotels than one year earlier. In June 2015, the total number of nights spent in hotels was just under 1.5 million, which was 0.7 per cent lower than twelve months earlier. Overnight stays by resident tourists increased by 1.6 per cent and accommodation establishments recorded 1,036,000 of them. By contrast, overnight stays by foreign tourists decreased by 5.8 per cent year-on-year and hotels recorded good 423,000 of them in June 2015. The occupancy rate of hotel rooms in the whole country was 56.6 per cent in June. One year earlier, it was nearly the same, 56.7 per cent. Among the regions, the highest occupancy rates of hotel rooms were measured in Uusimaa, 72.2 per cent, and Varsinais-Suomi, 65.9 per cent. In Vantaa, the hotel room occupancy rate rose to 76.2 per cent and in Turku to 70.7 per cent. The hotel room occupancy rate in Helsinki was 78.5 per cent. The biggest change in the hotel room occupancy rate occurred in Seinäjoki, up by 10.3 percentage points. In June, the realised average price of a hotel room was EUR 92.75 per day for the whole country. Twelve months previously, it was EUR 93.21. 2 Hotel room occupancy rate and the monthly average price Total number of nights spent at all accommodation establishments fell by 2 per cent in January to June Between January and June 2015, the number of nights spent at accommodation establishments in Finland was around nine million. This was 2.2 per cent lower than in the corresponding period one year earlier. The number of nights spent by resident tourists increased by 0.7 per cent while that of nights spent by foreign tourists decreased by 9.0 per cent. In all, 6.5 million overnight stays were recorded for resident tourists and 2.5 million for non-resident tourists at accommodation establishments. Between January and June 2015, the number of nights spent by Russian visitors at accommodation establishments in Finland totalled 422,000, which was 43.3 per cent down on the respective time period of last year. They were still by far the largest group of foreign visitors in January to June, as German visitors came next with good 253,000 overnight stays. Overnight stays of Germans went up by 7.1 per cent. In January to June, around 224,000 overnight stays were recorded for Swedish visitors and 192,000 for British tourists. The overnight stays of visitors from Sweden increased by 6.2 per cent and those of visitors from Great Britain by nearly one per cent from the previous year's corresponding time period. The number of overnight stays for French visitors was 130,000 in January to June. Visitors from the United States and Estonia accumulated around 91,000 overnight stays in January to June. Overnight stays by Estonian tourists remained more or less at last year's level, while those by tourists from the United States declined by 4.4 per cent year-on-year. Among tourists from the Mediterranean countries, overnight stays of Italian visitors increased by 4.8 per cent, whereas those of Spanish visitors decreased by 6.0 per cent from the corresponding period last year. Overnight stays by Italian tourists rose to 49,000 while those by Spanish visitors remained at 40,000. Among the most important countries of inbound tourism to Finland, overnight stays by Chinese visitors increased most, or by 37.9 per cent, during the January to June period. The number of overnight stays by Chinese visitors rose to good 70,000. 3 Change in overnight stays in January-June 2015/2014, % 4 Contents Tables Appendix tables Appendix table 1.1. Capacity and its utilization, June 2015.......................................................................................6 Appendix table 1.2. Capacity and its utilization, January-June 2015..........................................................................7 Appendix table 2.1. Nights spend in all establishments, June 2015............................................................................8 Appendix table 2.2. Nights spend in all establishments, January-June 2015..............................................................9 Appendix table 3.1. Hotel capacity and capacity utilization, June 2015...................................................................10 Appendix table 3.2. Hotel capacity and capacity utilization, January-June 2015.....................................................11 Appendix table 4.1. Nights spend in hotels, June 2015.............................................................................................12 Appendix table 4.2. Nights spend in hotels, January-June 2015...............................................................................13 Appendix table 5.1. Visitor arrivals and nights spend by country of residence, June 2015......................................14 Appendix table 5.2. Visitor arrivals and nights spend by country of residence, January-June 2015........................14 Appendix table 6. Nights spend in all establishments, 2015.....................................................................................15 5 Appendix tables Appendix table 1.1. Capacity and its utilization, June 2015 Region Number of Number of establishments bedrooms Occupancy rate of Change of the bedrooms, % occupancy rate compared to previous year, %-units Average price of nights spend, in euros (incl. VAT 10 %) Whole country 1,357 65,420 50.8 -0.3 47.32 Mainland Finland 1,283 63,691 50.9 -0.5 47.43 152 15,447 70.3 -1.2 65.82 Varsinais-Suomi 91 4,060 58.9 3.5 48.44 Satakunta 47 1,692 44.4 -0.0 47.91 Kanta-Häme 35 1,755 36.6 -3.6 38.85 Pirkanmaa 80 4,664 53.4 -0.7 47.02 Päijät-Häme 42 2,153 36.6 -10.0 35.91 Kymenlaakso 34 1,282 41.8 -8.3 32.86 South Karelia 44 2,162 45.7 -13.4 38.57 105 3,256 40.9 1.1 34.08 Pohjois-Savo 59 2,869 48.1 -2.0 44.35 North Karelia 61 1,769 45.1 -1.6 43.70 Central Finland 62 3,531 51.8 4.4 44.56 South Ostrobothnia 53 2,021 51.6 7.7 40.38 Ostrobothnia 41 1,583 50.2 0.4 40.67 Uusimaa Etelä-Savo Central Ostrobothnia 21 707 38.2 -4.3 44.44 111 4,709 43.9 -1.8 35.28 Kainuu 53 2,359 40.8 2.4 20.00 Lapland 192 7,672 31.1 1.5 33.46 74 1,729 49.7 5.5 1) North Ostrobothnia Åland 1) [..] Data too uncertain for presentation. 6 .. Appendix table 1.2. Capacity and its utilization, January-June 2015 Region Number of Number of establishments bedrooms Occupancy rate of Change of the bedrooms, % occupancy rate compared to previous year, %-units Average price of nights spend, in euros (incl. VAT 10 %) Whole country 1,146 59,874 46.5 -0.1 53.41 Mainland Finland 1,103 58,696 46.8 -0.1 53.46 143 14,926 59.3 -0.4 67.37 Varsinais-Suomi 69 3,671 46.5 0.7 52.04 Satakunta 41 1,491 37.8 2.2 56.80 Kanta-Häme 32 1,566 33.2 -0.6 45.17 Pirkanmaa 72 4,412 46.6 1.3 52.98 Päijät-Häme 37 1,985 37.3 -5.1 45.84 Kymenlaakso 30 1,170 36.0 -2.4 47.15 South Karelia 37 1,801 41.4 -5.3 47.52 Etelä-Savo 86 2,423 32.9 -2.2 40.03 Pohjois-Savo 53 2,632 44.3 -0.3 48.36 North Karelia 50 1,500 42.0 0.6 51.57 Central Finland 50 3,054 45.7 0.3 47.15 South Ostrobothnia 46 1,735 41.6 3.4 41.27 Ostrobothnia 32 1,402 44.4 0.6 53.79 Central Ostrobothnia 15 565 37.8 -4.4 55.42 North Ostrobothnia 98 4,423 46.5 2.0 44.16 Kainuu 45 2,220 41.5 0.9 33.56 Lapland 167 7,723 43.1 -0.7 48.18 44 1,178 31.0 3.0 1) Uusimaa Åland 1) [..] Data too uncertain for presentation. 7 .. Appendix table 2.1. Nights spend in all establishments, June 2015 Region Nights spend, total Change of Nights spend, nights spend, residents total, % Change of Nights spend, nights spend, non-residents residents, % Change of nights spend, non-residents, % Whole country 2,027,208 -2.5 1,502,938 -1.2 524,270 -6.2 Mainland Finland 1,955,421 -3.2 1,466,434 -1.8 488,987 -7.1 Uusimaa 529,542 0.7 278,385 4.4 251,157 -3.0 Varsinais-Suomi 139,500 2.1 107,803 -1.2 31,697 15.0 Satakunta 46,190 -0.5 39,940 0.2 6,250 -4.5 Kanta-Häme 39,154 -12.1 35,083 -14.1 4,071 10.7 146,381 -3.1 121,752 -3.2 24,629 -2.6 Päijät-Häme 52,334 -10.2 43,872 -9.7 8,462 -12.8 Kymenlaakso 38,840 -9.7 29,432 -6.1 9,408 -19.3 South Karelia 62,895 -10.8 45,195 6.9 17,700 -37.3 Etelä-Savo 92,383 -5.9 72,875 -2.8 19,508 -15.7 Pohjois-Savo 81,142 -7.6 71,760 -4.6 9,382 -25.3 Pirkanmaa North Karelia 55,599 -4.1 48,435 6.2 7,164 -41.9 131,232 -12.4 118,626 -12.1 12,606 -15.3 South Ostrobothnia 96,772 14.0 93,755 14.0 3,017 14.8 Ostrobothnia 55,517 12.3 48,329 17.2 7,188 -12.2 Central Ostrobothnia 17,455 -16.9 16,274 -12.3 1,181 -51.8 145,992 -14.8 128,029 -15.3 17,963 -10.6 Kainuu 77,762 -0.6 72,958 1.4 4,804 -23.4 Lapland 146,731 1.8 93,931 2.2 52,800 1.1 71,787 17.7 36,504 28.8 35,283 8.1 Central Finland North Ostrobothnia Åland 8 Appendix table 2.2. Nights spend in all establishments, January-June 2015 Region Nights spend, total Change of Nights spend, nights spend, residents total, % Change of Nights spend, nights spend, non-residents residents, % Change of nights spend, non-residents, % Whole country 9,016,299 -2.2 6,522,351 0.7 2,493,948 -9.0 Mainland Finland 8,865,581 -2.4 6,452,308 0.6 2,413,273 -9.5 Uusimaa 2,399,135 0.6 1,341,822 4.4 1,057,313 -3.9 Varsinais-Suomi 507,349 -0.8 408,350 -0.1 98,999 -3.3 Satakunta 155,380 -0.8 125,960 -2.1 29,420 5.5 Kanta-Häme 165,134 -6.0 148,429 -6.2 16,705 -4.2 Pirkanmaa 647,391 2.6 559,412 5.1 87,979 -11.0 Päijät-Häme 255,107 -11.6 217,449 -9.8 37,658 -20.6 Kymenlaakso 140,535 -3.9 102,222 5.8 38,313 -22.8 South Karelia 264,574 -14.7 174,838 16.8 89,736 -44.1 Etelä-Savo 280,404 -8.3 223,405 -0.3 56,999 -30.1 Pohjois-Savo 379,060 -2.1 330,583 1.0 48,477 -19.3 North Karelia 207,345 -5.6 164,588 -0.2 42,757 -21.9 Central Finland 485,472 -7.9 422,798 -6.2 62,674 -18.1 South Ostrobothnia 286,230 2.2 275,191 2.7 11,039 -9.2 Ostrobothnia 185,025 7.1 151,296 9.0 33,729 -0.6 62,941 -16.1 57,244 -14.4 5,697 -30.2 761,010 -1.4 629,629 -0.5 131,381 -5.8 Central Ostrobothnia North Ostrobothnia Kainuu Lapland Åland 484,061 -1.6 446,728 1.3 37,333 -27.0 1,199,428 -3.7 672,364 -3.9 527,064 -3.4 150,718 13.0 70,043 16.3 80,675 10.3 9 Appendix table 3.1. Hotel capacity and capacity utilization, June 2015 Region / municipality Number of Number of establishments bedrooms Occupancy rate of bedrooms, % 1) Change Room price, RevPAR, euros compared to euros (incl. VAT (incl. VAT 10 %) previous year, 10 %) %-units Whole country 628 51,723 56.6 -0.1 92.75 52.46 Mainland Finland 610 50,789 56.4 -0.2 92.68 52.29 Uusimaa 111 14,663 72.2 -0.3 106.48 76.88 Espoo 11 1,196 61.2 -5.0 86.21 52.75 Helsinki 52 8,848 78.5 0.6 113.41 89.00 Vantaa 11 2,237 76.2 2.2 96.21 73.28 42 3,071 65.9 2.9 93.27 61.47 Varsinais-Suomi Turku 19 2,041 70.7 1.8 92.95 65.72 Satakunta 27 1,264 47.6 -0.1 88.85 42.25 Pori 10 671 50.2 0.2 85.50 42.88 18 1,366 42.9 -4.1 74.81 32.11 8 671 40.0 1.4 84.12 33.63 Pirkanmaa 41 3,734 57.8 -0.6 95.45 55.16 Tampere 24 2,829 62.2 -1.8 97.83 60.87 15 1,765 39.8 -10.5 83.20 33.08 Kanta-Häme Hämeenlinna Päijät-Häme 6 641 46.4 -2.4 82.70 38.37 Kymenlaakso Lahti 18 975 41.9 -10.8 87.76 36.80 Kouvola 7 444 40.6 -9.3 82.42 33.47 South Karelia 19 1,574 48.4 -17.3 87.39 42.32 9 888 57.5 -20.5 79.42 45.65 Etelä-Savo 37 2,164 43.4 0.8 77.18 33.49 Mikkeli 9 630 50.9 1.3 84.76 43.12 Pohjois-Savo 31 2,388 51.0 -1.2 89.07 45.42 Kuopio 16 1,424 57.1 1.1 97.11 55.43 North Karelia 23 1,283 50.6 -2.4 89.94 45.50 Lappeenranta 8 682 57.9 -5.3 87.89 50.91 Central Finland Joensuu 28 2,825 56.4 2.3 88.05 49.68 Jyväskylä 13 1,586 58.5 3.3 85.25 49.91 South Ostrobothnia 23 1,508 61.0 8.6 81.69 49.87 Seinäjoki 7 602 63.6 10.3 90.99 57.88 Ostrobothnia 22 1,243 58.4 -0.3 97.85 57.18 8 811 67.4 1.8 101.72 68.60 9 525 43.3 -5.4 83.35 36.11 Vaasa Central Ostrobothnia Kokkola 5 408 47.6 -9.8 83.44 39.75 48 3,352 51.2 0.5 82.12 42.09 9 726 25.7 1.6 60.50 15.57 Oulu 11 1,441 69.6 3.2 87.96 61.19 Kainuu 20 1,765 47.4 2.2 48.07 22.76 6 409 41.5 3.6 77.66 32.19 North Ostrobothnia Kuusamo Kajaani Sotkamo Lapland Rovaniemi Åland Maarianhamina 6 1,098 53.8 1.4 37.69 20.29 78 5,324 36.5 3.8 68.46 25.00 12 1,242 56.6 2.9 71.43 40.45 18 934 64.2 6.9 .. .. 8 570 78.2 4.5 .. .. 1) RevPar = Average accommodation sales revenue per available room. Calculation formula: RevPar = Aver-age room price *Occupancy rate. [..] Data too uncertain for presentation. 10 Appendix table 3.2. Hotel capacity and capacity utilization, January-June 2015 Region / municipality Number of Number of establishments bedrooms 1) Occupancy rate Change Room price, RevPAR, euros of bedrooms, % compared to euros (incl. VAT (incl. VAT 10 %) previous year, 10 %) %-units Whole country 610 50,494 50.4 0.2 92.45 46.56 Mainland Finland 597 49,763 50.5 0.2 92.45 46.71 Uusimaa 112 14,363 60.2 -0.2 100.81 60.70 Espoo 11 1,195 51.9 -0.4 85.17 44.22 Helsinki 52 8,547 64.2 -0.7 106.02 68.11 Vantaa 11 2,236 68.9 -0.8 99.01 68.23 38 2,964 51.0 0.8 85.44 43.54 Varsinais-Suomi Turku 19 2,038 53.5 0.4 87.21 46.66 Satakunta 25 1,149 44.3 3.3 83.22 36.89 Pori 9 645 45.8 4.2 82.89 37.93 18 1,329 36.7 -0.6 75.65 27.80 8 707 34.8 0.2 87.32 30.38 Pirkanmaa 41 3,769 49.3 1.7 93.93 46.32 Tampere 25 2,959 52.3 0.2 95.40 49.93 15 1,750 39.8 -5.1 82.26 32.73 Kanta-Häme Hämeenlinna Päijät-Häme 6 644 45.8 -0.5 87.92 40.25 Kymenlaakso Lahti 16 913 39.1 -0.7 87.21 34.07 Kouvola 6 432 38.7 0.5 81.43 31.53 South Karelia 17 1,374 44.6 -7.7 91.56 40.81 8 773 54.8 -3.4 83.13 45.56 Etelä-Savo 30 1,648 37.5 -1.5 73.18 27.41 Mikkeli 8 565 44.4 -0.4 79.65 35.36 Pohjois-Savo 31 2,335 46.3 0.2 86.63 40.14 Kuopio 16 1,414 52.1 0.8 91.92 47.89 North Karelia 22 1,211 46.5 0.4 89.45 41.55 Lappeenranta 7 623 58.5 0.9 89.66 52.45 Central Finland Joensuu 27 2,662 48.9 0.4 86.03 42.10 Jyväskylä 12 1,408 51.5 0.2 88.39 45.53 South Ostrobothnia 22 1,434 47.6 3.1 75.65 36.00 Seinäjoki 6 560 52.2 3.9 83.75 43.71 Ostrobothnia 22 1,242 47.9 1.5 88.17 42.24 8 802 55.0 1.7 90.57 49.81 9 486 40.0 -4.6 84.02 33.58 Vaasa Central Ostrobothnia Kokkola 5 369 44.5 -7.1 86.21 38.38 48 3,403 51.7 3.8 85.50 44.16 Kuusamo 11 763 41.7 1.5 97.69 40.77 Oulu 12 1,532 62.9 5.0 88.71 55.76 Kainuu 20 1,765 45.2 -0.2 71.97 32.53 6 409 36.7 2.0 78.62 28.87 North Ostrobothnia Kajaani Sotkamo Lapland Rovaniemi Åland Maarianhamina 6 1,101 53.2 -0.9 70.80 37.66 85 5,967 47.9 0.1 99.84 47.79 12 1,257 58.9 -0.8 91.55 53.96 13 731 39.0 4.5 .. .. 6 446 51.9 5.5 .. .. 1) RevPar = Average accommodation sales revenue per available room. Calculation formula: RevPar = Aver-age room price *Occupancy rate.[..] Data too uncertain for presentation. 11 Appendix table 4.1. Nights spend in hotels, June 2015 Region / municipality Nights spend, total Change of Nights spend, nights spend, residents total, % Change of Nights spend, nights spend, non-residents residents, % Change of nights spend, non-residents, % Whole country 1,459,343 -0.7 1,035,991 1.6 423,352 -5.8 Mainland Finland 1,423,634 -1.1 1,015,816 1.1 407,818 -6.4 Uusimaa 482,541 1.9 245,182 6.8 237,359 -2.7 Espoo 33,507 -2.9 19,958 13.9 13,549 -20.3 Helsinki 312,901 2.6 130,928 5.9 181,973 0.4 Vantaa 78,513 4.3 45,796 10.8 32,717 -3.7 99,984 3.6 76,647 0.6 23,337 14.7 Varsinais-Suomi Turku 70,680 1.2 54,683 0.3 15,997 4.3 Satakunta 26,799 -5.7 21,745 -7.6 5,054 3.3 Pori 15,973 4.2 13,862 1.8 2,111 22.6 29,478 -5.5 25,618 -9.8 3,860 37.1 14,149 -1.1 11,879 -5.7 2,270 32.8 Pirkanmaa 111,194 -1.4 91,346 -1.4 19,848 -1.5 Tampere 87,365 4.2 68,784 5.5 18,581 -0.2 35,826 -13.0 29,573 -14.1 6,253 -6.9 Kanta-Häme Hämeenlinna Päijät-Häme 12,999 -11.5 9,372 -20.3 3,627 23.4 Kymenlaakso Lahti 17,994 -25.2 13,212 -22.7 4,782 -31.5 Kouvola 8,429 -19.7 7,081 -10.4 1,348 -48.0 South Karelia 44,807 -16.6 31,243 1.4 13,564 -40.8 28,352 -8.7 21,674 5.8 6,678 -36.9 Etelä-Savo 48,290 -3.2 40,248 1.1 8,042 -20.1 Mikkeli 16,698 1.0 12,345 5.2 4,353 -9.2 Pohjois-Savo 63,569 0.3 55,916 0.6 7,653 -2.4 Lappeenranta Kuopio 42,296 3.7 37,223 4.2 5,073 -0.4 North Karelia 35,142 0.6 31,341 17.6 3,801 -54.1 Joensuu 18,150 0.7 15,765 30.2 2,385 -59.7 Central Finland 86,111 -4.7 74,902 -2.7 11,209 -16.1 Jyväskylä 42,246 1.8 34,377 7.8 7,869 -18.0 South Ostrobothnia 56,429 13.1 54,309 13.0 2,120 15.7 Seinäjoki 17,616 23.8 16,159 21.5 1,457 56.0 Ostrobothnia 33,973 5.7 28,604 12.6 5,369 -20.3 26,079 7.3 21,612 14.7 4,467 -18.3 10,430 -16.9 9,494 -12.4 936 -45.4 Vaasa Central Ostrobothnia Kokkola 8,785 -19.3 7,958 -14.2 827 -48.5 82,428 -9.3 68,981 -9.5 13,447 -7.9 Kuusamo 11,451 5.2 10,323 14.5 1,128 -39.6 Oulu 45,973 -7.9 36,866 -4.5 9,107 -19.5 Kainuu 61,763 1.2 59,354 3.1 2,409 -30.6 7,190 5.0 6,194 5.8 996 0.0 51,390 0.5 50,404 2.4 986 -49.1 96,876 3.3 58,101 5.9 38,775 -0.3 35,229 11.8 21,292 27.7 13,937 -6.0 35,709 21.1 20,175 30.1 15,534 11.1 24,654 24.6 14,714 26.4 9,940 22.1 North Ostrobothnia Kajaani Sotkamo Lapland Rovaniemi Åland Maarianhamina 12 Appendix table 4.2. Nights spend in hotels, January-June 2015 Region / municipality Nights spend, total Change of Nights spend, nights spend, residents total, % Change of Nights spend, nights spend, non-residents residents, % Change of nights spend, non-residents, % Whole country 7,375,400 -1.4 5,248,542 2.2 2,126,858 -9.1 Mainland Finland 7,285,089 -1.5 5,204,127 2.1 2,080,962 -9.5 Uusimaa 2,250,592 0.6 1,256,005 5.2 994,587 -4.8 Espoo 160,145 -0.1 100,644 12.7 59,501 -16.2 1,419,150 -0.2 681,484 2.6 737,666 -2.6 409,278 0.8 259,900 8.9 149,378 -10.7 424,357 -0.0 343,746 1.1 80,611 -4.4 Helsinki Vantaa Varsinais-Suomi Turku 298,813 -0.3 241,226 1.3 57,587 -6.2 Satakunta 121,628 -1.6 94,595 -4.3 27,033 9.1 Pori 73,360 6.3 60,367 4.1 12,993 17.9 142,950 -0.7 126,949 -1.2 16,001 3.9 73,297 -2.7 65,352 -0.8 7,945 -16.1 Pirkanmaa 540,244 3.9 463,280 6.8 76,964 -10.8 Tampere 431,001 6.6 359,033 10.1 71,968 -8.0 208,517 -11.7 177,758 -9.9 30,759 -20.6 Kanta-Häme Hämeenlinna Päijät-Häme 75,307 -9.8 55,151 -10.6 20,156 -7.6 Kymenlaakso Lahti 88,695 -13.0 63,475 -4.5 25,220 -28.9 Kouvola 43,245 -5.8 34,749 0.6 8,496 -25.3 South Karelia 210,432 -18.4 139,298 16.8 71,134 -48.7 137,359 -9.3 102,980 18.9 34,379 -47.0 Etelä-Savo 181,708 -5.4 158,062 -0.6 23,646 -28.4 Mikkeli 70,859 -3.4 58,912 3.6 11,947 -27.7 Pohjois-Savo 329,455 0.5 292,725 3.1 36,730 -16.4 Kuopio 225,179 3.8 199,908 7.2 25,271 -16.9 North Karelia 166,024 -1.2 132,703 5.6 33,321 -21.1 Lappeenranta 91,394 0.3 69,943 8.3 21,451 -19.2 Central Finland Joensuu 414,069 -5.9 355,848 -3.2 58,221 -19.2 Jyväskylä 196,266 -0.9 168,750 1.6 27,516 -13.9 South Ostrobothnia 216,773 1.9 207,942 2.3 8,831 -6.8 Seinäjoki 74,221 1.4 68,221 0.2 6,000 16.5 Ostrobothnia 148,389 4.6 116,987 5.8 31,402 0.2 110,250 1.9 83,739 1.7 26,511 2.4 48,745 -13.1 44,695 -11.6 4,050 -26.6 Vaasa Central Ostrobothnia Kokkola 39,917 -14.1 36,443 -12.1 3,474 -30.5 535,407 2.2 437,479 3.7 97,928 -4.0 Kuusamo 136,126 0.8 104,891 8.8 31,235 -19.2 Oulu 265,779 4.5 224,533 7.6 41,246 -9.8 Kainuu 364,514 -0.5 338,579 2.8 25,935 -30.3 38,787 0.4 34,503 0.2 4,284 1.8 308,680 0.1 291,653 3.9 17,027 -38.3 892,590 -3.3 454,001 -2.9 438,589 -3.7 220,589 5.6 92,495 15.4 128,094 -0.5 90,311 14.1 44,415 14.0 45,896 14.2 68,218 18.8 35,781 16.7 32,437 21.2 North Ostrobothnia Kajaani Sotkamo Lapland Rovaniemi Åland Maarianhamina 13 Appendix table 5.1. Visitor arrivals and nights spend by country of residence, June 2015 Country of residence Visitor arrivals in all Nights spend in all accommodation accommodation establishments establishments Total Change of nights Nights spend in spend in all hotels accommodation establishments, % Change of nights spend in hotels, % 1,107,199 2,027,208 -2.5 1,459,343 -0.7 Finland 824,141 1,502,938 -1.2 1,035,991 1.6 Foreign countries 283,058 524,270 -6.2 423,352 -5.8 Sweden 33,311 61,441 7.1 41,587 5.0 Germany 41,987 69,121 -0.8 52,121 -1.0 Russia 32,825 62,931 -39.0 43,437 -39.3 United Kingdom 13,899 28,558 0.2 24,513 -1.5 United States 13,190 27,983 -14.5 26,891 -14.7 Norway 8,920 15,240 -0.3 12,124 -3.1 Netherlands 8,937 15,468 2.5 11,119 2.2 Italy 5,466 10,400 -6.3 8,839 -7.8 France 8,474 15,480 5.3 12,673 4.2 Japan 10,470 18,070 7.5 17,529 7.4 Estonia 7,031 15,508 -9.8 9,725 -10.8 Switzerland 8,754 15,626 1.4 11,460 -0.8 Spain 4,233 8,081 -16.9 7,390 -3.1 China 17,037 25,271 32.4 24,986 33.7 Appendix table 5.2. Visitor arrivals and nights spend by country of residence, January-June 2015 Country of residence Visitor arrivals in all accommodation establishments Nights spend in all accommodation establishments Change of nights Nights spend in spend in all hotels accommodation establishments, % Change of nights spend in hotels, % Total 4,754,970 9,016,299 -2.2 7,375,400 -1.4 Finland 3,607,911 6,522,351 0.7 5,248,542 2.2 Foreign countries 1,147,059 2,493,948 -9.0 2,126,858 -9.1 Sweden 132,119 224,310 6.2 192,449 6.1 Germany 116,248 253,169 7.1 219,410 7.7 Russia 183,804 422,413 -43.3 313,545 -45.5 United Kingdom 76,574 192,106 0.8 166,068 0.1 United States 42,494 91,567 -4.4 88,613 -4.0 Norway 39,385 77,834 1.6 65,268 -2.6 Netherlands 37,024 88,972 -3.1 72,803 -1.1 Italy 22,867 49,204 4.8 44,738 5.9 France 46,011 130,097 6.7 118,019 7.1 Japan 44,469 80,590 -6.5 78,319 -5.9 Estonia 37,013 90,920 0.4 65,139 -4.3 Switzerland 26,332 67,169 3.5 48,455 -0.4 Spain 17,641 40,224 -6.0 36,781 -2.8 China 43,138 70,403 37.9 68,443 39.7 14 Appendix table 6. Nights spend in all establishments, 2015 Month Nights spend, total Change of nights spend, total, % Nights spend, residents Change of nights spend, residents, % Nights spend, non-residents Change of nights spend, non-residents, % Total 9,016,299 -2.2 6,522,351 0.7 2,493,948 -9.0 January 1,276,236 -7.9 788,300 2.9 487,936 -21.2 February 1,448,043 1.6 1,053,198 3.1 394,845 -2.0 March 1,574,555 -3.1 1,162,155 -0.4 412,400 -9.8 April 1,345,270 -0.3 1,056,742 0.9 288,528 -4.7 May 1,344,987 -0.4 959,018 0.8 385,969 -3.4 June 2,027,208 -2.5 1,502,938 -1.2 524,270 -6.2 15 Transport and Tourism 2015 Inquiries Taru Tamminen Kari Keränen Director in charge: Hannele Orjala 029 551 2243 029 551 3208 liikenne.matkailu@stat.fi www.stat.fi Source: Accommodation Statistics. Statistics Finland Communication and Information Services, Statistics Finland tel. +358 29 551 2220 www.stat.fi Publication orders, Edita Publishing Oy tel. +358 20 450 05 www.editapublishing.fi ISSN 1796-0479 = Official Statistics of Finland ISSN 1799-6325 (pdf)
