Graph of Trigonometric Functions
advertisement
Graph of Trigonometric Functions
Sine and Cosine (Recall)
In general, the sinusoidal functions of the form
y = a sin(k(x − b)) and
y = a cos(k(x − b))
and phase shift b. That means it makes more
have amplitude a, period 2π
k
sense to graph the function in the interval [b, b + 2π
]. (Or graph y =
k
2π
a sin(kx) or y = a cos(kx) first in the interval [0, k ] and then shift it
to the right interval.
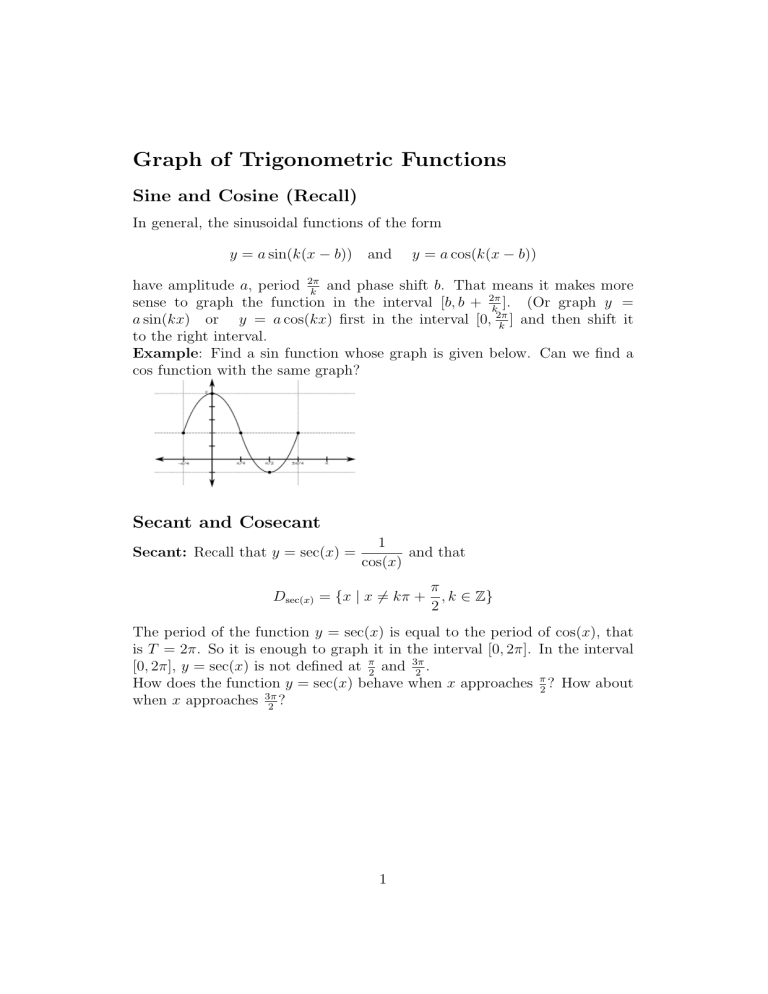
Example: Find a sin function whose graph is given below. Can we find a
cos function with the same graph?
Secant and Cosecant
Secant: Recall that y = sec(x) =
1
and that
cos(x)
Dsec(x) = {x | x 6= kπ +
π
, k ∈ Z}
2
The period of the function y = sec(x) is equal to the period of cos(x), that
is T = 2π. So it is enough to graph it in the interval [0, 2π]. In the interval
[0, 2π], y = sec(x) is not defined at π2 and 3π
.
2
How does the function y = sec(x) behave when x approaches π2 ? How about
when x approaches 3π
?
2
1
So, x = π2 and x = 3π
are vertical asymptotes of y = sec(x). In fact,
2
x = kπ + π2 for all k ∈ Z are all vertical asymptotes of y = sec(x).
Use the table of values to graph y = sec(x).
x
0
sec(x)
π
6
π
3
π
2
2π
3
Cosecant: Recall that y = csc(x) =
5π
6
π
7π
6
4π
3
3π
2
5π
3
11π
6
1
and that
sin(x)
Dcsc(x) = {x | x 6= kπ, k ∈ Z}
The period of the function y = csc(x) is equal to the period of sin(x), that
is T = 2π. So it is enough to graph it in the interval [0, 2π]. In the interval
[0, 2π], y = csc(x) is not defined at 0, π and 2π.
How does the function y = sec(x) behave when x approaches 0? or π? How
about when x approaches 2π?
So, x = 0 and x = π, and x = 2π are vertical asymptotes of y = csc(x). In
2
2π
fact, x = kπ for all k ∈ Z are all vertical asymptotes of y = csc(x).
Use the table of values to graph y = sec(x).
x
0
csc(x)
π
6
π
3
π
2
2π
3
5π
6
π
7π
6
4π
3
3π
2
5π
3
11π
6
Transformations of Secant and Cosecant
In general, a function of the general form
y = a sec(k(x − b)) or y = a csc(k(x − b))
, and each branch has
looks like sec(x) or cos(x), but with the period T = 2π
k
minimum (or maximum) of a (or −a). Plus, the graph is shifted b units to
the right.
Example Graph the following functions.
y = 2 sec(3x + π2 )
y = 5 csc(πx − π3 )
3
2π
Tangent and Cotangent
Tangent: Recall that y = tan(x) =
sin(x)
cos(x)
and that
Dtan(x) = {x | x 6= kπ +
π
, k ∈ Z}.
2
The period of y = tan x is π. Why?
That is, it is enough to graph the function y = tan(x) in any interval of
length π. It makes more sense (the graph will explain why) to choose the
interval [− π2 , π2 ]. In this interval, y = tan(x) is not defined at − π2 and π2 .
How does the function y = tan(x) behave when x approaches π2 ? or − π2 ?
So, x = π2 and x = − π2 are vertical asymptotes of y = tan(x). In fact,
x = kπ + π2 for all k ∈ Z are all vertical asymptotes of y = tan(x).
Using the table of values we see that the graph of y = tan(x) is given by
4
Cotangent: Recall that y = cot(x) =
cos(x)
sin(x)
and that
Dtan(x) = {x | x 6= kπ, k ∈ Z}.
The period of y = cot x is π.
That is, it is enough to graph the function y = cot(x) in any interval of
length π. We choose the interval [0, π]. In this interval, y = tan(x) is not
defined at 0 and π.
How does the function y = cot(x) behave when x approaches 0? or π?
So, x = 0 and x = π are vertical asymptotes of y = cot(x). In fact, x = kπ
for all k ∈ Z are all vertical asymptotes of y = cot(x).
Using the table of values we see that the graph of y = cot(x) is given by
Transformations of Tangent and Cotangent
In general, a function of the general form
y = a tan(k(x − b)) or y = a cot(k(x − b))
looks like tan(x) or cot(x), but with the period T = 2π
. An appropriate
k
π π
interval to graph y = a tan(kx) is [− 2k , 2k ] An appropriate interval to graph
y = a cot(kx) is [0, πk ].
5
Plus, the graph of y = a tan(k(x − b)) or y = a cot(k(x − b)) is the
graph of y = a tan(kx) or y = a cot(kx) shifted b units to the right.
Example Graph the following functions.
y = tan( 23 x − π6 )
y = cot(2x − π2 )
6
