the Key for Cycle Time Reduction & Capacity Improvements
advertisement
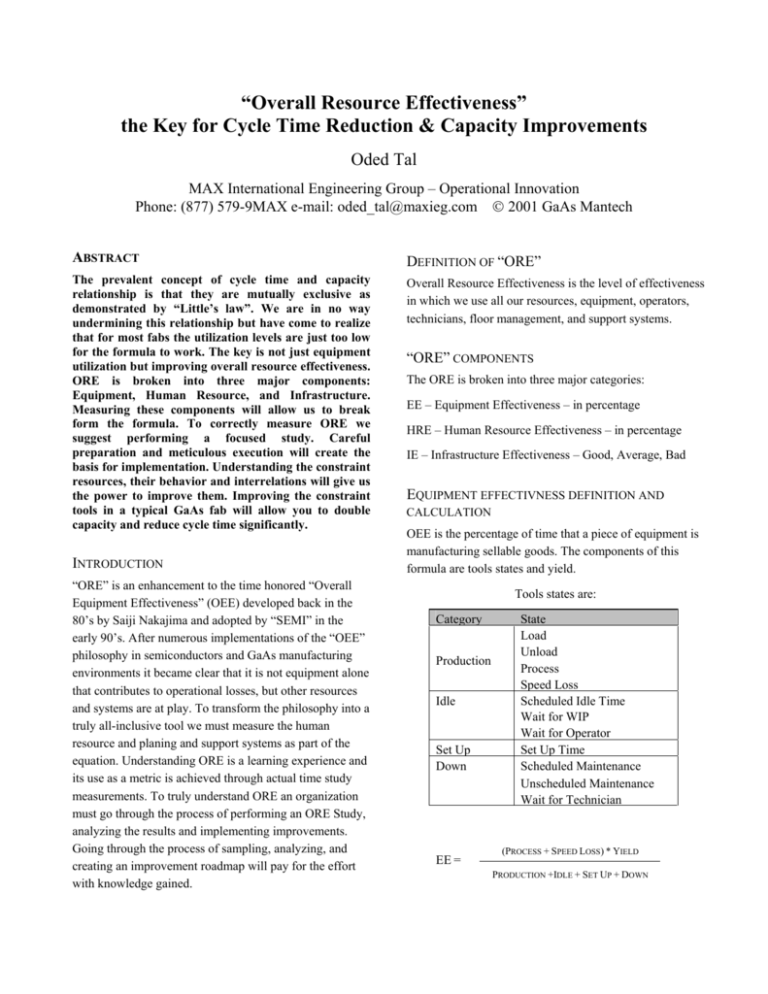
“Overall Resource Effectiveness” the Key for Cycle Time Reduction & Capacity Improvements Oded Tal MAX International Engineering Group – Operational Innovation Phone: (877) 579-9MAX e-mail: oded_tal@maxieg.com © 2001 GaAs Mantech ABSTRACT DEFINITION OF “ORE” The prevalent concept of cycle time and capacity relationship is that they are mutually exclusive as demonstrated by “Little’s law”. We are in no way undermining this relationship but have come to realize that for most fabs the utilization levels are just too low for the formula to work. The key is not just equipment utilization but improving overall resource effectiveness. ORE is broken into three major components: Equipment, Human Resource, and Infrastructure. Measuring these components will allow us to break form the formula. To correctly measure ORE we suggest performing a focused study. Careful preparation and meticulous execution will create the basis for implementation. Understanding the constraint resources, their behavior and interrelations will give us the power to improve them. Improving the constraint tools in a typical GaAs fab will allow you to double capacity and reduce cycle time significantly. Overall Resource Effectiveness is the level of effectiveness in which we use all our resources, equipment, operators, technicians, floor management, and support systems. INTRODUCTION “ORE” is an enhancement to the time honored “Overall Equipment Effectiveness” (OEE) developed back in the 80’s by Saiji Nakajima and adopted by “SEMI” in the early 90’s. After numerous implementations of the “OEE” philosophy in semiconductors and GaAs manufacturing environments it became clear that it is not equipment alone that contributes to operational losses, but other resources and systems are at play. To transform the philosophy into a truly all-inclusive tool we must measure the human resource and planing and support systems as part of the equation. Understanding ORE is a learning experience and its use as a metric is achieved through actual time study measurements. To truly understand ORE an organization must go through the process of performing an ORE Study, analyzing the results and implementing improvements. Going through the process of sampling, analyzing, and creating an improvement roadmap will pay for the effort with knowledge gained. “ORE” COMPONENTS The ORE is broken into three major categories: EE – Equipment Effectiveness – in percentage HRE – Human Resource Effectiveness – in percentage IE – Infrastructure Effectiveness – Good, Average, Bad EQUIPMENT EFFECTIVNESS DEFINITION AND CALCULATION OEE is the percentage of time that a piece of equipment is manufacturing sellable goods. The components of this formula are tools states and yield. Tools states are: Category Production Idle Set Up Down EE = State Load Unload Process Speed Loss Scheduled Idle Time Wait for WIP Wait for Operator Set Up Time Scheduled Maintenance Unscheduled Maintenance Wait for Technician (PROCESS + SPEED LOSS) * YIELD PRODUCTION +IDLE + SET UP + DOWN HUMAN RESOURCE EFFECTIVNESS DEFINITION HOW TO PERFORM AN ORE STUDY AND CALCULATION Resources: ♦ Objective persons to sample the activities. ♦ Typically 4 samplers on a 24x7 schedule can measure a 30,000-sqft clean room in one week, capturing all the major resources. (Assuming electronic data gathering equipment is used). ♦ For the most cases you are looking on an overall effort of 4 to 5 weeks to prepare, sample, analyze the data and suggest an improvement roadmap. ♦ You need a tool to collect and analyze these measurements - for a full fab coverage you will need a professional “Time Study” database, but for focusing on just one bottleneck a wrist watch, clean room pen and paper will do. Preparation: ♦ Start by defining the most important resources to measure – always look for the constraint resources. ♦ A clear definition of all the activities (states) that can be performed by these resources and how to differentiate between those states. ♦ Qualitative data is just as important, make sure that you guide the participants to keep their eyes and ears open and try to get as much of the environment and activities as they can. ♦ Credibility is the base for improvement, if the study is not perceived as reliable, the implementation will fail. Always make sure operators, technicians, and engineers are involved in defining the resources to be sampled and determining their states. ♦ Last but not least – inform all the people involved about the study and explain exactly what you are measuring, how and why. HRE is the percentage of time that an individual (operator, technician, support engineer) is performing value-added activities. Operator States Category State Working Material Handeling Load & Unload Monitor Admin Idle Idle HRE = LOAD & UNLOAD + MONITOR WORKING + IDLE Muda (Waste) is the percentage of time a human resource is doing non value added activities MUDA = ADMIN + MATERIAL HANDLING WORKING + IDLE We aim to eliminate Muda altogether, but 5% is a reasonable goal. INFRASTRUCTURE EFFECTIVENESS DEFINITION Unlike EE and HRE the infrastructure effectiveness is not measured on the floor nor can it be quantified in percentage. To assess the strength of the infrastructure one needs to understand all the players and systems involved in manufacturing. The implementation level of a Manufacturing Execution System, detailed capacity and resource allocation models is examined. Note: to really understand the infrastructure one must first go through the EE and HRE stages. HOW TO PERFORM THE ACTUAL SAMPLING WHO CAN BENEFIT FROM “ORE” To determine whether an ORE approach is applicable to your environment ask yourself the following questions: ♦ Is the manufacturing process complex? ♦ Is there a human and equipment interaction? ♦ Is there an added value from increasing capacity and reducing cycle time using the same resources? Will freeing resources will help the organization? A positive answer to any of these questions means that the ORE approach will work for you! Once you have identified the relevant resource to measure and mapped all related activities the measurement process is simple. You prepare a list capturing all the different resources and states and perform a time study sampling. A time study is a process in which you visit a resource on a repetitive basis every given time (10 to 15 minutes typically) and note the state this resource is in. After you have sampled enough times you have a statistically valid sample. In that sample you have the number of times the resource was observed in a specific state. STATE X FREQUENCY = NUMBER OF TIMES STATE X OBSERVED TOTAL NUMBER OF OBSERVATIONS If you have a statistically valid sample size each state frequency will capture the true time the resource spends in each state. As can be seen in the chart the same tool behaves differently on different shifts due to different operation methods different tech and operator coverage. Always validate your activity list by running a pilot and sampling for 4 to 5 hours before deciding your list is valid and starting the actual study. In most cases the lack in efficiency in tool operation reflects also on the human resource management Typical Human Resource on Bottleneck Area Litho Operators Activity Analysis “ORE” RESULTS AND HOW TO INTERPRET THEM Not Present in Bay 4.5% Once all the results are collected and frequencies are analyzed the results provide you with a snap shot of how the sampled resources behave. Material Handling 8.6% Idle 29.6% Typical Bottleneck Tool AS M ste ppe r EE Cha rt Working 46.7% Admin Monitor 7.7% 2.9% Availabilit y Loss Oper at ional 2.5% HRE = 49.6% Ef f iciency Loss % Muda = 37.3% 41.2% EE 44.3% As can be seen from the chart the performance of human resource needs to be examined. Qualit y Loss 2.4% Typical actual floor coverage Pr oduct ion Rat e Ef f iciency Relat ed Loss Set up Loss 7.6% 0.3% Loss 1.8% Litho Opr. Attendance Chart 9 Typically the average bottleneck tool’s ORE level is at 60% to 70% in Silicon fabs, 40% 50% in GaAs. In the implementation phase we have successfully pushed Bottleneck tools to 80% to 90%. The difference between the percentage you find and 80% (to be conservative) is the improvement you can achieve. E.g. going from 40% ORE to 80% on the bottleneck resource can double your capacity or cut cycle time by half without adding any major capital equipment. Typical Comparison between shifts or team ASM stepper Fab Teams Comparison 100% 80% % 60% 40% 20% 0% A B C D Fab Team PRODUCTION SETUP IDLE DOWN # Of Sampled Opr. 8 7 0.52% 1.82% 3.90% 10.39% 6 17.66% 5 19.74% 4 22.08% 3 13.25% 2 6.23% 1 4.42% 0 0% 5% 10% 15% 20% 25% % It is clear that taking the ORE approach elevates many opportunities for improvement that would otherwise be missed. Before you can start getting improvements you must create a reasonable improvement plan. Remember it is not possible to fix everything at once and not all problems have a similar impact. Last topic to be covered in the data analysis is the look at infrastructure and its interference with production. In the following chart we saw an idle time from 6:30 to 7:00 am. A short investigation showed that the MES backup was designed in a manner that caused the tools to stop processing for 30 minutes while the system was down. A relatively easy fix that claimed back 30 minutes each day. A look at the behavior of a tool across the day ASM 5500 Stepper Interval Chart Production SetUp Idle 11:30:00 PM - 12:29:59 AM 10:30:00 PM - 11:29:59 PM 9:30:00 PM - 10:29:59 PM 8:30:00 PM - 9:29:59 PM 7:30:00 PM - 8:29:59 PM 6:30:00 PM - 7:29:59 PM 5:30:00 PM - 6:29:59 PM 4:30:00 PM - 5:29:59 PM 3:30:00 PM - 4:29:59 PM 2:30:00 PM - 3:29:59 PM 1:30:00 PM - 2:29:59 PM 12:30:00 PM - 1:29:59 PM 11:30:00 AM - 12:29:59 PM 10:30:00 AM - 11:29:59 AM 9:30:00 AM - 10:29:59 AM 8:30:00 AM - 9:29:59 AM 7:30:00 AM - 8:29:59 AM 6:30:00 AM - 7:29:59 AM 5:30:00 AM - 6:29:59 AM 4:30:00 AM - 5:29:59 AM 3:30:00 AM - 4:29:59 AM 2:30:00 AM - 3:29:59 AM 1:30:00 AM - 2:29:59 AM 12:30:00 AM - 1:29:59 AM % Time 100% 90% 80% 70% 60% 50% 40% 30% 20% 10% 0% Interval Down IMPLEMENTATION STAGE – CAPACITY, CYCLE TIME, OR BOTH. As stated before you can choose to direct your improvements toward cycle time, capacity or both. It is important to remember that reducing your cycle time by half requires doubling your line’s performance, so does increasing your capacity by a 100%. If you are at 40% ORE and your goal is 80% it means you can not achieve both. A reasonable goal for such a scenario would be doubling capacity and reducing cycle time by as much as 30% depending on WIP levels. Cycle Time vs. Tools Utilization we all know and use has some underlying assumptions. This relationship assumes high equipment utilization and ignores the fact that for the same equipment utilization you can have different operational efficiencies and therefore different CT and TPT. IMPROVEMENT ROADMAP Start from the prioritized list of improvements and create an actual schedule. Putting the improvement process on a time line will give you a way to determine the number of resources you need for the implementation, and the duration and cost of the implementation process. KEY ISSUES IN IMPLEMENTATION. 20 To implement solutions for the opportunities found an interdisciplinary team should be initiated and involved in all stages. Representatives from operation, maintenance, process engineering, and facilities will be the key players. Find a strong facilitator for the team and empower the team to act. CT X Fact or 15 10 5 CONCLUSION 0 0.1 0.2 0.3 0.4 0.5 0.6 0.7 0.8 0.9 1 Utilization Factor Relationship of CT to Utilization Factor The relationship formula between cycle time and utilization To get changes in order of magnitudes, diving into the details is needed. ORE gives you exactly that. The added resource utilization created by en ORE implementation will allow you to improve throughput, cycle time, or both.
