0021-972X/06/$15.00/0
Printed in U.S.A.
The Journal of Clinical Endocrinology & Metabolism 91(10):3922–3927
Copyright © 2006 by The Endocrine Society
doi: 10.1210/jc.2006-1054
Oligoanovulation with Polycystic Ovaries But Not
Overt Hyperandrogenism
Didier Dewailly, Sophie Catteau-Jonard, Anne-Céline Reyss, Maryse Leroy, and Pascal Pigny
Department of Endocrine Gynecology and Reproductive Medicine (D.D., S.C.-J., A.-C.R., M.L.), Hôpital Jeanne de Flandre,
and Faculty of Medicine of Lille, Université de Lille II and Laboratory of Endocrinology (P.P.), Parc Eurasanté, Centre
Hospitalier Régional Universitaire, 59037 Lille, France
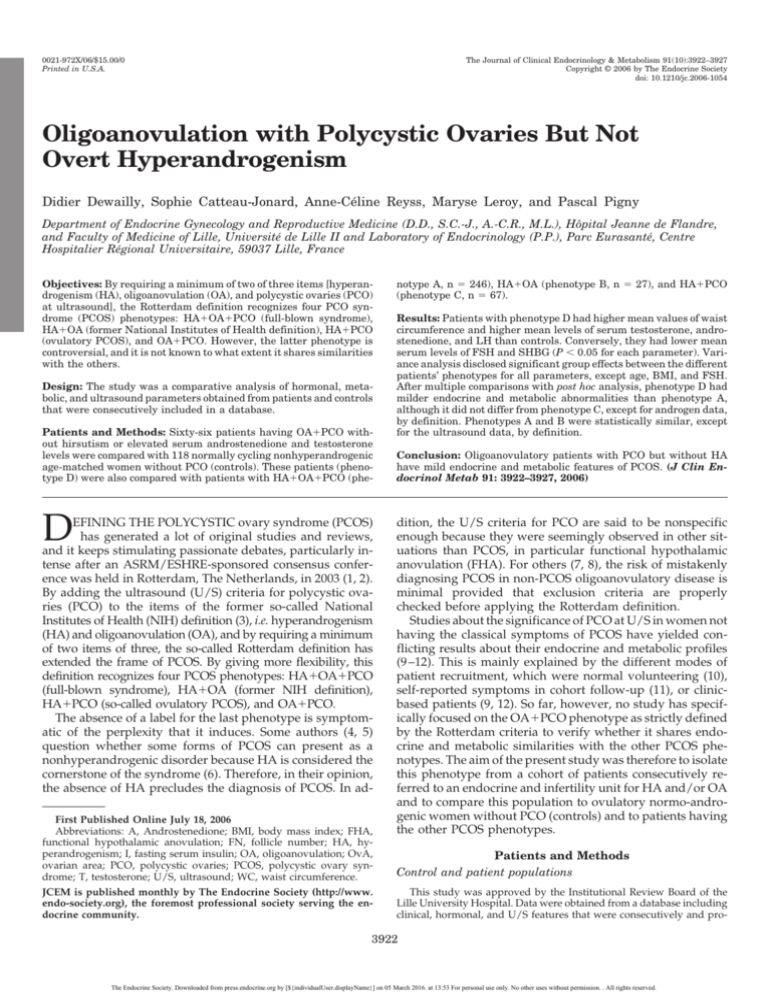
Objectives: By requiring a minimum of two of three items [hyperandrogenism (HA), oligoanovulation (OA), and polycystic ovaries (PCO)
at ultrasound], the Rotterdam definition recognizes four PCO syndrome (PCOS) phenotypes: HA⫹OA⫹PCO (full-blown syndrome),
HA⫹OA (former National Institutes of Health definition), HA⫹PCO
(ovulatory PCOS), and OA⫹PCO. However, the latter phenotype is
controversial, and it is not known to what extent it shares similarities
with the others.
Design: The study was a comparative analysis of hormonal, metabolic, and ultrasound parameters obtained from patients and controls
that were consecutively included in a database.
Patients and Methods: Sixty-six patients having OA⫹PCO without hirsutism or elevated serum androstenedione and testosterone
levels were compared with 118 normally cycling nonhyperandrogenic
age-matched women without PCO (controls). These patients (phenotype D) were also compared with patients with HA⫹OA⫹PCO (phe-
D
EFINING THE POLYCYSTIC ovary syndrome (PCOS)
has generated a lot of original studies and reviews,
and it keeps stimulating passionate debates, particularly intense after an ASRM/ESHRE-sponsored consensus conference was held in Rotterdam, The Netherlands, in 2003 (1, 2).
By adding the ultrasound (U/S) criteria for polycystic ovaries (PCO) to the items of the former so-called National
Institutes of Health (NIH) definition (3), i.e. hyperandrogenism
(HA) and oligoanovulation (OA), and by requiring a minimum
of two items of three, the so-called Rotterdam definition has
extended the frame of PCOS. By giving more flexibility, this
definition recognizes four PCOS phenotypes: HA⫹OA⫹PCO
(full-blown syndrome), HA⫹OA (former NIH definition),
HA⫹PCO (so-called ovulatory PCOS), and OA⫹PCO.
The absence of a label for the last phenotype is symptomatic of the perplexity that it induces. Some authors (4, 5)
question whether some forms of PCOS can present as a
nonhyperandrogenic disorder because HA is considered the
cornerstone of the syndrome (6). Therefore, in their opinion,
the absence of HA precludes the diagnosis of PCOS. In adFirst Published Online July 18, 2006
Abbreviations: A, Androstenedione; BMI, body mass index; FHA,
functional hypothalamic anovulation; FN, follicle number; HA, hyperandrogenism; I, fasting serum insulin; OA, oligoanovulation; OvA,
ovarian area; PCO, polycystic ovaries; PCOS, polycystic ovary syndrome; T, testosterone; U/S, ultrasound; WC, waist circumference.
JCEM is published monthly by The Endocrine Society (http://www.
endo-society.org), the foremost professional society serving the endocrine community.
notype A, n ⫽ 246), HA⫹OA (phenotype B, n ⫽ 27), and HA⫹PCO
(phenotype C, n ⫽ 67).
Results: Patients with phenotype D had higher mean values of waist
circumference and higher mean levels of serum testosterone, androstenedione, and LH than controls. Conversely, they had lower mean
serum levels of FSH and SHBG (P ⬍ 0.05 for each parameter). Variance analysis disclosed significant group effects between the different
patients’ phenotypes for all parameters, except age, BMI, and FSH.
After multiple comparisons with post hoc analysis, phenotype D had
milder endocrine and metabolic abnormalities than phenotype A,
although it did not differ from phenotype C, except for androgen data,
by definition. Phenotypes A and B were statistically similar, except
for the ultrasound data, by definition.
Conclusion: Oligoanovulatory patients with PCO but without HA
have mild endocrine and metabolic features of PCOS. (J Clin Endocrinol Metab 91: 3922–3927, 2006)
dition, the U/S criteria for PCO are said to be nonspecific
enough because they were seemingly observed in other situations than PCOS, in particular functional hypothalamic
anovulation (FHA). For others (7, 8), the risk of mistakenly
diagnosing PCOS in non-PCOS oligoanovulatory disease is
minimal provided that exclusion criteria are properly
checked before applying the Rotterdam definition.
Studies about the significance of PCO at U/S in women not
having the classical symptoms of PCOS have yielded conflicting results about their endocrine and metabolic profiles
(9 –12). This is mainly explained by the different modes of
patient recruitment, which were normal volunteering (10),
self-reported symptoms in cohort follow-up (11), or clinicbased patients (9, 12). So far, however, no study has specifically focused on the OA⫹PCO phenotype as strictly defined
by the Rotterdam criteria to verify whether it shares endocrine and metabolic similarities with the other PCOS phenotypes. The aim of the present study was therefore to isolate
this phenotype from a cohort of patients consecutively referred to an endocrine and infertility unit for HA and/or OA
and to compare this population to ovulatory normo-androgenic women without PCO (controls) and to patients having
the other PCOS phenotypes.
Patients and Methods
Control and patient populations
This study was approved by the Institutional Review Board of the
Lille University Hospital. Data were obtained from a database including
clinical, hormonal, and U/S features that were consecutively and pro-
3922
The Endocrine Society. Downloaded from press.endocrine.org by [${individualUser.displayName}] on 05 March 2016. at 13:53 For personal use only. No other uses without permission. . All rights reserved.
Dewailly et al. • Nonhyperandrogenic PCOS
J Clin Endocrinol Metab, October 2006, 91(10):3922–3927
Hormonal immunoassays
TABLE 1. Definition and frequencies of the four patients’
phenotypes
Phenotype
Phenotype
Phenotype
Phenotype
A (n ⫽ 246; 60.6%)
B (n ⫽ 27; 6.7%)
C (n ⫽ 67; 16.5%)
D (n ⫽ 66; 16.3%)
3923
HA
OA
PCO at U/S
Yes
Yes
Yes
No
Yes
Yes
No
Yes
Yes
No
Yes
Yes
spectively recorded between 2000 and 2005 in patients referred to our
department, after obtaining their informed consent. The following exclusion criteria were applied to select both patients and controls for this
study: age less than 18 yr, presence of premature ovarian failure (FSH ⬎
12 IU/liter), hyperprolactinemia (prolactin ⬎ 20 ng/ml), or nonclassic
21-hydroxylase deficiency (basal 17-hydroxyprogesterone ⬎ 2 ng/ml
and/or post-ACTH stimulated value ⬎ 12 ng/ml) (13).
Controls. The control population consisted of 118 healthy women whose
age (20 –38.5 yr.) was matched to patients. Their mean body mass index
(BMI) ranged from 16.5– 44 kg/m2. They were referred for in vitro fertilization because of tubal and/or male infertility. Exclusion criteria were
a history of menstrual disturbances (i.e. cycle length either ⬍25 d or ⬎35
d), hirsutism (i.e. modified Ferriman-Gallwey score ⬎ 6), abnormal
serum level of androgens [i.e. ⬎95th percentile of our previous control
group (14), which was 0.6 ng/ml for serum testosterone (T) and 2.2
ng/ml for serum androstenedione (A)], PCO at U/S (see below), and
hormonal treatment during the 3 months before the study.
Patients. Data from 406 women aged 19 –38 yr were used for this study.
BMI ranged from 16.1–56.2 kg/m2. All patients were referred to our
department for HA and/or OA. At least two of the following three items
were required for patients’ inclusion in this study, according to the
Rotterdam classification (1, 2): 1) HA, defined clinically as the presence
of hirsutism (modified Ferriman-Gallwey score ⬎ 6) and/or biologically
by serum testosterone (T) and/or androstenedione (A) level greater than
0.6 ng/ml and 2.2 ng/ml, respectively; 2) OA, defined as the presence
of oligomenorrhea (i.e. less than eight menstrual bleedings during the
last year) or amenorrhea (i.e. no menstrual bleeding during the last 3
months); 3) presence of PCO at U/S, according to the Rotterdam criteria
(15), except that we used an ovarian area (OvA) of more than 6 cm2
instead of an ovarian volume of more than 10 cm3 because only OvA was
recorded in our database until late 2003.
Amenorrheic patients having a history of food restriction, intensive
exercise, no progestin-induced withdrawal bleeding, and/or a basal
serum LH less than 1 IU/liter were considered as primarily having FHA.
They were therefore excluded, even though PCO were seen at U/S in
some of them. No patient took hormonal treatment during the 3 months
before the study, except didrogesterone (see above) for some of them.
Blood sampling was performed in the early follicular phase (i.e. between d 2 and 5 after the last menstrual period) both in patients and
control women, as previously described (14). In oligo- or amenorrheic
patients, the last menstrual period was either spontaneous or induced
by the administration of didrogesterone (10 mg/d for 7 d). SHBG, A, T,
LH, FSH and fasting serum insulin (I) levels were measured by immunoassays as described previously (14).
Pelvic U/S examination
In every patient and control, U/S examination was performed the
same day as blood sampling, between cycle d 2 and 5, with a 7-MHz
transvaginal transducer (Logic 400; General Electric, Milwaukee, WI).
U/S measurements were taken in real time, according to a standardized
protocol as previously reported (16). Patients in whom transvaginal U/S
was inappropriate (virgin or refusing patients) were excluded from the
analysis as well as those in whom the sum of follicles from both ovaries
was not at least five and/or in whom the ovarian area was below the
lower normal limit, i.e. 2.5 cm2. Any patient or control with at least one
follicle with a diameter greater than 9 mm at U/S or a serum estradiol
level above 80 pg/ml was excluded from the study so as not to confound
the hormonal data with the presence of a dominant follicle.
Statistical methods
A P value ⬍ 0.05 was considered significant. The 2 and Student’s t
tests were used to compare two independent groups, where appropriate.
All variables that had a log-normal distribution were log-transformed
before statistical calculations. For comparison of three or more groups,
variance analysis (ANOVA) was first performed to search for a group
effect. When this effect was significant, differences between subgroups
were searched through two by two comparisons with post hoc Bonferroni’s correction for multiple comparisons. All statistic procedures were
run on SPSS 11.5 (SPSS Inc., Chicago, IL).
Results
Distribution of patients according to the
phenotypic classification
Table 1 shows that OA with PCO but without HA (phenotype D) accounted for only 16% of the patients, a proportion similar to that of phenotype C (HA⫹PCO). About two
thirds of our patients met the former NIH definition (i.e. OA
and HA, phenotypes A⫹B). Twenty-seven (10%) of these 273
patients had no evidence of PCO (phenotype B) (Table 2).
TABLE 2. Characteristics of patients and controls
Phenotypes
Age (yr)
BMI (kg/m2)
I (mIU/liter)
WC (cm)
SHBG (mmol/liter)
T (ng/ml)
A (ng/ml)
LH (IU/liter)
FSH (IU/liter)
2–9 mm FN
OvA (cm2)
A (n ⫽ 246)
B (n ⫽ 27)
C (n ⫽ 67)
D (n ⫽ 66)
28.0 (20.0 –35.5)
27.0 (18.8 – 42.6)
6.2 (1.1–29.9)
86.0 (65.0 –122)
30 (13.0 –76.7)
0.50 (0.20 –1.10)
2.69 (1.53– 4.30)
6.8 (2.1–16.6)
5.2 (3.1–7.6)
20.0 (11.0 – 43.7)
6.3 (4.0 – 8.9)
28 (22.2–36.4)
25.7 (18.8 – 41.5)
4.7 (0.8 –19.5)
81 (61.6 –112)
28 (8.4 –77.4)
0.54 (0.18 –1.18)
2.63 (1.40 – 4.50)
6.0 (1.9 –12.1)
5.2 (2.6 –7.2)
9.75 (4.0 –11.5)
4.7 (3.0 –5.5)
28.0 (22.0 –36.2)
25.2 (18.6 – 40.8)
5.0 (1.5–15.8)
82.5 (64.4 –115.0)
37.3 (11.0 –77.2)
0.41 (0.16 – 0.84)
2.47 (1.26 – 4.16)
4.3 (1.6 –13.4)
5.2 (3.9 –7.0)
17.5 (6.1–29.5)
5.75 (3.8 –7.5)
28.0 (22.0 –35.6)
23.5 (18.7– 41.8)
3.8 (1.0 –15.8)b
76.0 (64.0 –115.2)a,b
47.3 (18.3– 82.6)a,b
0.31 (0.09 – 0.55)a,b,c,d
1.66 (1.09 –2.16)a,b,c,d
4.4 (1.8 –13.1)a,b
5.1 (3.2–7.8)a
17.75 (11.8 –33.2)a,c
5.6 (3.9 –9.2)a,b,c
Controls (n ⫽ 118)
28.0 (22.0 –34.5)
23.0 (18.3–38.2)
3.4 (0.9 –11.0)
73.0 (60.0 –105.9)
51 (23.9 – 83.2)
0.25 (0.05– 0.53)
1.40 (0.83–2.07)
3.8 (2.0 –7.6)
6.1 (4.3–9.0)
7.0 (4.2–10.3)
3.9 (2.8 –5.2)
Values represent median (5–95th percentile). To convert T to nmol/liter, multiply by 3.467; to convert A to nmol/liter, multiply by 3.492.
a
Phenotype D significantly different from controls (P ⬍ 0.05).
b, c, d
Phenotype D significantly different from phenotypes A, B, and C, respectively (P ⬍ 0.05 after post hoc Bonferroni’s correction for multiple
comparisons).
The Endocrine Society. Downloaded from press.endocrine.org by [${individualUser.displayName}] on 05 March 2016. at 13:53 For personal use only. No other uses without permission. . All rights reserved.
3924
J Clin Endocrinol Metab, October 2006, 91(10):3922–3927
Comparison between phenotype D and controls
All the recorded parameters except age (P ⫽ 0.74), BMI
(P ⫽ 0.068), and I (P ⫽ 0.13) were significantly different
between patients with phenotype D and controls (Table 2).
Notably, the serum T and A mean levels were significantly
higher in phenotype D than in controls, although all individual values were within the normal range, by definition.
Comparison between phenotype D and other phenotypes
When applied to the whole patients’ population, variance
analysis (ANOVA) disclosed a significant group effect between phenotypes A, B, C, and D for all parameters except
age (P ⫽ 0.82), BMI (P ⫽ 0.22), and FSH (P ⫽ 0.82). Figures
1 and 2 show a trend from phenotype A to phenotype D
toward progressively lower mean values of waist circumference (WC) (P ⬍ 0.03); toward lower mean levels of serum
Dewailly et al. • Nonhyperandrogenic PCOS
T (P ⬍ 0.0001), A (P ⬍ 0.0001), LH (P ⬍ 0.0001), and I (P ⬍
0.008); and conversely toward progressively higher mean
serum levels of SHBG (P ⬍ 0.003). The ANOVA was also
significant for the follicle number (FN) (P ⬍ 0.0001) and the
OvA (P ⬍ 0.0001).
After two by two comparisons with post hoc Bonferroni’s
correction for multiple comparisons, no significant difference was found between phenotypes C and D, except for
androgen data, by definition (Table 2). On the other hand,
beside androgens, phenotype D had significantly lower
mean WC, lower mean LH and I levels, and higher mean
SHBG level than phenotype A as well as significantly
smaller mean OvA but similar FN (Table 2). Phenotypes A
and B were statistically similar, except for U/S data, by
definition (Table 2). Phenotype C had significantly lower
mean LH and T levels as well as mean OvA than phenotype A (Table 2).
FIG. 1. Box-and-whisker plots showing the distribution of individual values for serum T (A), A (B), LH (C), and FSH (D) in controls and in
patients with phenotypes A–D. Horizontal small bars represent the 5–95th percentile range, and the boxes indicate the 25–75th percentile range.
The horizontal line in each box corresponds to the median. E, Values beyond the 95th percentile; *, values beyond the 99th percentile. See Table
2 for comparisons between groups. To convert T to nmol/liter, multiply by 3.467. To convert A to nmol/liter, multiply by 3.492.
The Endocrine Society. Downloaded from press.endocrine.org by [${individualUser.displayName}] on 05 March 2016. at 13:53 For personal use only. No other uses without permission. . All rights reserved.
Dewailly et al. • Nonhyperandrogenic PCOS
J Clin Endocrinol Metab, October 2006, 91(10):3922–3927
3925
FIG. 2. Box-and-whisker plots showing the distribution of individual values for BMI (A), waist circumference (B), and SHBG (C) in controls
and in patients with phenotypes A–D. Horizontal small bars represent the 5–95th percentile range, and the boxes indicate the 25–75th percentile
range. The horizontal line in each box corresponds to the median. E, Values beyond the 95th percentile; *, values beyond the 99th percentile.
See Table 2 for comparisons between groups. To convert T to nmol/liter, multiply by 3.467. To convert A to nmol/liter, multiply by 3.492.
Discussion
In this population carefully selected by stringent exclusion
criteria, two thirds of the patients met the former NIH definition for PCOS (i.e. HA and OA, phenotypes A and B), and
most of them (90%) had PCO at U/S (phenotype A). Presumably, phenotype B corresponded to false-negative results
of U/S (i.e. FN ⬍ 12 and OvA ⬍ 6.0 cm2). Indeed, except for
U/S features, both groups were statistically similar. Such a
low false-negative rate (10%) of U/S in the group of patients
having a full-blown PCOS confirms the validity of the U/S
criteria that we used. They were those proposed by the Rotterdam consensus conference (15), except that we used the
OvA instead of the ovarian volume (see Patients and Methods).
According to our recent study (17), an OvA of 6.0 cm2 corresponds to an ovarian volume of 10 ml, and this threshold
has similar sensitivity and specificity to an ovarian volume
of more than 10 ml to define PCO.
Providing the presence of PCO, patients presenting with
only either HA or OA have other PCOS phenotypes (phenotypes C and D, respectively), according to the Rotterdam
classification (1, 2). Each phenotype accounted for only one
sixth of our patients’ population. However, such prevalence
data have limited value because they may vary substantially
depending on whether the clinical setting is oriented to endocrinology or to infertility. Because of the dual orientation
of our unit, we had the opportunity to recruit equally both
phenotypes. Phenotype C, so-called ovulatory PCOS in the
literature, does not suffer from controversy anymore (18). As
shown previously by others (19, 20), our patients with this
phenotype had indices of both gonadotropin dysregulation
and insulin resistance. However, their mean LH and T levels
as well as their mean OvA were lower than in the full-blown
PCOS, in agreement with others’ findings (19, 20).
Our data indicate that patients with nonhyperandrogenic
OA (phenotype D) had in fact slightly but significantly
higher mean androgen levels than controls, although by def-
inition, all individual values were within the normal range.
This raises the question about the validity of using an upper
normal threshold for the androgen data as a yes or no answer
to the question of whether this patient is normo- or hyperandrogenic? This holds true for the Ferriman-Gallwey score,
which suffers from a high subjectivity, as well as for the
serum T and A assays, which have weak sensitivities, lower
than those of U/S criteria for PCO (21). For this reason, we
think that the absence of overt HA might simply represent
a false-negative finding in many of our patients with phenotype D and that it is not sufficient by itself to preclude the
diagnosis of PCOS.
Moreover, in support of our opinion that the absence of
overt HA cannot be exclusive, our patients with phenotype
D had respectively higher and lower LH and FSH mean
levels than controls, a typical figure of the gonadotropin
derangement of PCOS. Notably, the degree of FSH suppression was similar to other phenotypes. In addition, their mean
WC was higher, a parameter that has been recently shown to
be one of the most sensitive markers of the metabolic syndrome in patients with typical PCOS (22). Accordingly, their
mean SHBG level was significantly lower than controls, a
finding being considered as a marker of hyperinsulinism
(23). On the other hand, their mean I level was not different
from controls, whereas their mean WC and I and SHBG levels
were significantly less than in patients with phenotype A.
These data fit with previous reports indicating a trend toward higher insulin levels along with a higher degree of
symptoms in women with PCO recruited either as normal
volunteers (10) or via hyperandrogenic symptoms (24).
Nonetheless, the presence of OA in the face of minimal insulin resistance implies that the ovulation disorder of PCOS
is not exclusively driven by insulin resistance and that other
still unknown factors are likely to be involved.
That OA patients with PCO but without overt HA constitute a PCOS phenotype is a highly disputed issue. Some
authors argue that such patients cannot be differentiated
The Endocrine Society. Downloaded from press.endocrine.org by [${individualUser.displayName}] on 05 March 2016. at 13:53 For personal use only. No other uses without permission. . All rights reserved.
3926
J Clin Endocrinol Metab, October 2006, 91(10):3922–3927
from patients suffering from other causes of OA because
multifollicular ovaries or even PCO have been described in
patients with FHA (25, 26) or with bulimia nervosa (27).
However, the finding of genuine PCO in such patients is
questionable. In the above mentioned studies that were published before the Rotterdam conference, no consensual
threshold for the number of small (2–9 mm) follicles was used
to define the follicle excess. Such data should be revisited
now that this threshold is consensually set at 12 follicles per
whole ovary, because it yielded a very low false-positive rate
(1%) in our previously reported experience comparing patients with full-blown PCOS with controls (16). Nevertheless,
if we leave aside the unsolved issue about U/S, we admit that
an artificial PCOS phenotype could be built by applying too
carelessly the Rotterdam definition to normo-androgenic
women with OA and PCO. There is therefore some fear that
the Rotterdam classification leads to an overspill of the PCOS
population, and this raises medical, psychological, and economic concerns (28). However, in the setting of an infertility
unit, the risk exists mainly for women with FHA. In this
situation, amenorrhea is not reversible after progestin withdrawal, and although BMI can be normal, patients have a
history of food restriction, with indices of negative energy
balance and LH deficiency (29, 30). Such features were not
observed in our women with phenotype D who were slightly
more overweight than controls and who had a mildly elevated mean LH level. Therefore, on condition that FHA is
carefully excluded before applying the Rotterdam criteria, as
we did in the present study, we and others (7) think that the
risk is low for the Rotterdam definition to include erroneously non-PCOS ovulatory disorders. Lastly, one should also
consider the possibility that both FHA and PCOS could coexist in the same patient. It has been recently reported that
some women with FHA caused by anorexia nervosa had
genuine PCO at U/S that were previously associated with
hyperandrogenic symptoms before the patients became amenorrheic and turned off their LH secretion because of food
restriction (31).
In conclusion, our data indicate that OA with PCO but
without overt HA constitutes a phenotype that has subtle
PCOS endocrine and metabolic features and is presumably
the mildest form of PCOS, with minimal insulin resistance.
Whether this phenotype shares the same long-term risks as
the classical PCOS remains to be elucidated to inform the
patients appropriately.
Acknowledgments
We thank the staffs of the Laboratoire de Biochimie et Hormonologie,
Parc Eurasanté, and of the Service de Radiologie, Hôpital Jeanne de
Flandre, Centre Hospitalier Régional Universitaire de Lille, for their
excellent technical help. We also thank Ms. Sophie Delva and Céline
Vandaele for collecting the clinical data and Mrs. Lydie Lombardo and
Sylvie Vanoverschelde for collecting the blood samples. We thank Dr.
Alain Duhamel, Centre d’études et de recherches en informatique médicale, University of Lille 2, for his help with the statistics.
Received May 16, 2006. Accepted July 12, 2006.
Address all correspondence and requests for reprints to: Didier Dewailly, Department of Endocrine Gynecology and Reproductive Medicine, Hôpital Jeanne de Flandre, Centre Hospitalier Régional Universitaire, 59037 Lille, France. E-mail: ddewailly@chru-lille.fr.
Dewailly et al. • Nonhyperandrogenic PCOS
This work was supported by the Délégation à la Recherche du Centre
Hospitalier Universitaire de Lille (France) and the Direction Régionale
des Etudes Doctorales, Université de Lille II, France.
Disclosure statement: The authors have nothing to disclose.
References
1. Rotterdam ESHRE/ASRM-Sponsored PCOS Consensus Workshop Group
2004 Revised 2003 consensus on diagnostic criteria and long-term health risks
related to polycystic ovary syndrome. Fertil Steril 81:19 –25
2. The Rotterdam ESHRE/ASRM-Sponsored PCOS Consensus Workshop
Group 2004 Revised 2003 consensus on diagnostic criteria and long-term
health risks related to polycystic ovary syndrome (PCOS). Hum Reprod 19:
41–74
3. Zawadzki JK, Dunaif A 1992 Diagnostic criteria for polycystic ovary syndrome: towards a rational approach. In: Dunaif A, Givens JR, Haseltine FP,
Merriam GR, eds. Polycystic ovary syndrome. Boston: Blackwell Scientific;
377–384
4. Azziz R 2006 Controversy in clinical endocrinology: diagnosis of polycystic
ovarian syndrome: the Rotterdam criteria are premature. J Clin Endocrinol
Metab 91:781–785
5. Azziz R 2005 Diagnostic criteria for polycystic ovary syndrome: a reappraisal.
Fertil Steril 83:1343–1346
6. Azziz R 2003 Androgen excess is the key element in polycystic ovary syndrome. Fertil Steril 80:252–254
7. Franks S 2006 Controversy in clinical endocrinology: diagnosis of polycystic
ovarian syndrome: in defense of the Rotterdam criteria. J Clin Endocrinol
Metab 91:786 –789
8. Dewailly D 2006 How many of the items in the polycystic ovary syndrome can
be validated statistically? Fertil Steril 85:529
9. Norman RJ, Hague WM, Masters SC, Wang XJ 1995 Subjects with polycystic
ovaries without hyperandrogenaemia exhibit similar disturbances in insulin
and lipid profiles as those with polycystic ovary syndrome. Hum Reprod
10:2258 –2261
10. Michelmore K, Ong K, Mason S, Bennett S, Perry L, Vessey M, Balen A,
Dunger D 2001 Clinical features in women with polycystic ovaries: relationships to insulin sensitivity, insulin gene VNTR and birth weight. Clin Endocrinol (Oxf) 55:439 – 446
11. Taponen S, Ahonkallio S, Martikainen H, Koivunen R, Ruokonen A, Sovio
U, Hartikainen AL, Pouta A, Laitinen J, King V, Franks S, McCarthy MI,
Jarvelin MR 2004 Prevalence of polycystic ovaries in women with self-reported symptoms of oligomenorrhoea and/or hirsutism: Northern Finland
Birth Cohort 1966 Study. Hum Reprod 19:1083–1088
12. Ng EH, Chan CC, Ho PC 2006 Are there differences in ultrasound parameters
between Chinese women with polycystic ovaries only and with polycystic
ovary syndrome? Eur J Obstet Gynecol Reprod Biol 125:92–98
13. Azziz R, Dewailly D, Owerbach D 1994 Nonclassic adrenal hyperplasia:
current concepts. J Clin Endocrinol Metab 78:810 – 815
14. Pigny P, Merlen E, Robert Y, Cortet-Rudelli C, Decanter C, Jonard S, Dewailly D 2003 Elevated serum level of anti-Mullerian hormone in patients with
polycystic ovary syndrome: relationship to the ovarian follicle excess and to
the follicular arrest. J Clin Endocrinol Metab 88:5957–5962
15. Balen AH, Laven JS, Tan SL, Dewailly D 2003 Ultrasound assessment of the
polycystic ovary: international consensus definitions. Hum Reprod Update
9:505–514
16. Jonard S, Robert Y, Cortet-Rudelli C, Pigny P, Decanter C, Dewailly D 2003
Ultrasound examination of polycystic ovaries: is it worth counting the follicles?
Hum Reprod 18:598 – 603
17. Jonard S, Robert Y, Dewailly D 2005 Revisiting the ovarian volume as a
diagnostic criterion for polycystic ovaries. Hum Reprod 20:2893–2898
18. Carmina E, Lobo RA 1999 Do hyperandrogenic women with normal menses
have polycystic ovary syndrome? Fertil Steril 71:319 –322
19. Carmina E, Lobo RA 2001 Polycystic ovaries in hirsute women with normal
menses. Am J Med 111:602– 606
20. Adams JM, Taylor AE, Crowley Jr WF, Hall JE 2004 Polycystic ovarian
morphology with regular ovulatory cycles: insights into the pathophysiology
of polycystic ovarian syndrome. J Clin Endocrinol Metab 89:4343– 4350
21. van Santbrink EJ, Hop WC, Fauser BC 1997 Classification of normogonadotropic infertility: polycystic ovaries diagnosed by ultrasound versus endocrine
characteristics of polycystic ovary syndrome. Fertil Steril 67:452– 458
22. Ehrmann DA, Liljenquist DR, Kasza K, Azziz R, Legro RS, Ghazzi MN 2006
PCOS/Troglitazone Study Group. Prevalence and predictors of the metabolic
syndrome in women with polycystic ovary syndrome. J Clin Endocrinol Metab
91:48 –53
23. Pugeat M, Crave JC, Elmidani M, Nicolas MH, Garoscio-Cholet M, Lejeune
H, Dechaud H, Tourniaire J 1991 Pathophysiology of sex hormone binding
globulin (SHBG): relation to insulin. J Steroid Biochem Mol Biol 40:841– 849
24. Carmina E, Chu MC, Longo RA, Rini GB, Lobo RA 2005 Phenotypic variation
in hyperandrogenic women influences the findings of abnormal metabolic and
cardiovascular risk parameters. J Clin Endocrinol Metab 90:2545–2549
The Endocrine Society. Downloaded from press.endocrine.org by [${individualUser.displayName}] on 05 March 2016. at 13:53 For personal use only. No other uses without permission. . All rights reserved.
Dewailly et al. • Nonhyperandrogenic PCOS
25. Adams J, Franks S, Polson DW, Mason HD, Abdulwahid N, Tucker M 1985
Multifollicular ovaries: clinical and endocrine features and response to pulsatile gonadotropin releasing hormone. Lancet 2:1375–1379
26. Futterweit W, Yeh HC, Mechanick JI 1988 Ultrasonographic study of ovaries
of 19 women with weight loss-related hypothalamic oligo-amenorrhea.
Biomed Pharmacother 42:279 –283
27. Morgan JF, McCluskey SE, Brunton JN, Hubert Lacey J 2002 Polycystic
ovarian morphology and bulimia nervosa: a 9-year follow-up study. Fertil
Steril 77:928 –931
28. Azziz R, Marin C, Hoq L, Badamgarav E, Song P 2005 Health care-related
J Clin Endocrinol Metab, October 2006, 91(10):3922–3927
3927
economic burden of the polycystic ovary syndrome during the reproductive
life span. J Clin Endocrinol Metab 90:4650 – 4658
29. Warren MP 1996 Evaluation of secondary amenorrhea. J Clin Endocrinol
Metab 81:437– 442
30. Couzinet B, Young J, Brailly S, Le Bouc Y, Chanson P, Schaison G 1999
Functional hypothalamic amenorrhoea: a partial and reversible gonadotrophin
deficiency of nutritional origin. Clin Endocrinol (Oxf) 50:229 –235
31. Pinhas-Hamiel O, Pilpel N, Carel C, Singer S 2006 Clinical and laboratory
characteristics of adolescents with both polycystic ovary disease and anorexia
nervosa. Fertil Steril 85:1849 –1851
JCEM is published monthly by The Endocrine Society (http://www.endo-society.org), the foremost professional society serving the
endocrine community.
The Endocrine Society. Downloaded from press.endocrine.org by [${individualUser.displayName}] on 05 March 2016. at 13:53 For personal use only. No other uses without permission. . All rights reserved.

