Creating a topo profile and blank cross section using ArcGIS
advertisement
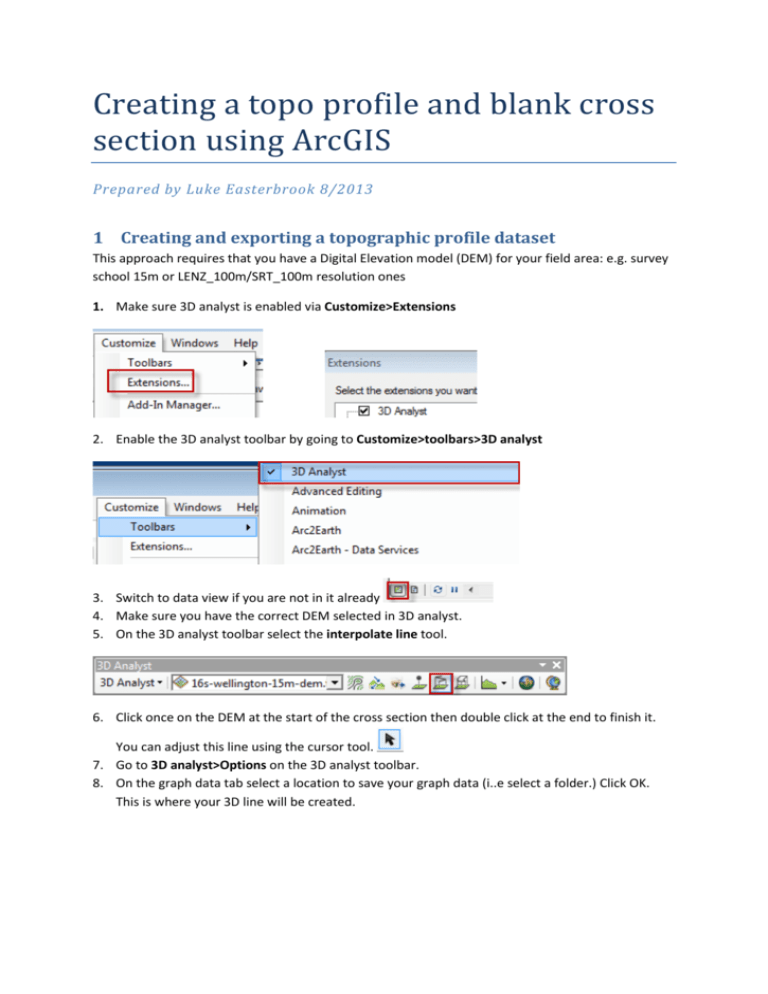
Creating a topo profile and blank cross section using ArcGIS Prepared by Luke Easterbrook 8/2013 1 Creating and exporting a topographic profile dataset This approach requires that you have a Digital Elevation model (DEM) for your field area: e.g. survey school 15m or LENZ_100m/SRT_100m resolution ones 1. Make sure 3D analyst is enabled via Customize>Extensions 2. Enable the 3D analyst toolbar by going to Customize>toolbars>3D analyst 3. Switch to data view if you are not in it already 4. Make sure you have the correct DEM selected in 3D analyst. 5. On the 3D analyst toolbar select the interpolate line tool. 6. Click once on the DEM at the start of the cross section then double click at the end to finish it. You can adjust this line using the cursor tool. 7. Go to 3D analyst>Options on the 3D analyst toolbar. 8. On the graph data tab select a location to save your graph data (i..e select a folder.) Click OK. This is where your 3D line will be created. 9. With the profile line selected (blue rectangle) Click on graph data on the 3D analyst toolbar. 10. 11. 12. 13. 14. 15. This will bring a graph up in a new window. The graph function in ArcGIS is crappy like the Excel one. But you can export the data. Here is one way to do this. First close the graph. When you clicked graph data a file called PG1.shp was created in the graph folder you selected. Bring this file onto your map using ArcCatalog. Right click on “PG1.shp” and open the attribute table. The two imporant values are M (distance along line) and Z (Elevation) We only want to copy the M and Z values so we can delete the other ones by right clicking on the headers and choosing Turn Field Off (if you don’t delete them they will cause issues in the next stage which is creating the blank cross section) 16. Select all the values by Ctrl+A or Table menu>Select All 17. Right Click on the row headers (grey boxes) and choose Copy selected 18. Now you can paste the data into an excel spreasheet or into a new text file (as tab delimited). 19. For graphing the data you could use excel. Unfortunetly you have to muck around to get the correct aspect ratio. Another option is to use a better graphing software such as MATLAB. Or use ArcGIS, where you can set the correct scale (i.e. 1:10,000) and gaurantee that the X and Y will be equal. See instructions next page. 2 Tips and tricks for creating a topographic profile 2.1 Check points along the line If you want to check how far a point is along the line use the identify tool value. and look at the M 2.2 Less dense sampling along a line 1. By default there will be a lot of points created for your graph. You can reduce the number of points by going to 3D analyst>Options on the 3D analyst toolbar. 2. Switch to the Interpolation Tab and set a user specified distance for the profile sampling. I.e. 100m 2.3 Add XY points to the export EITHER • • Add XY points to the attribute table by using the “Add XY Coordinates” tool (search for xy in ArcGIS). When you copy and paste attribute table it will include these. OR Select “export feature attributes to ascii” from arc toolbox. This will export the points and their attributes. 3 Formatting a cross section profile in ArcGIS This approach pretends that M=X and Z=Y so that you can plot a cross section as if it were a map and add a grid etc. 1. Open a new map document or open the template provided. 2. IMPORTANT: ArcGIS cannot deal with the first M value being ‘0’ in the section dataset (the dataset with M and Z values). It will not recognise the rest of that column as doubles (decimal numbers). The workaround is to change the first M value to ‘0.01’ in a text editor or excel. 3. In ArcCatalog right click on the exported section dataset (after you have changed the first M value to 0.01). 4. Choose Create feature class>From XY table 5. 6. 7. 8. Set M for the X field and Z for the Y field Set the export to the desired location. Drag and drop the exported shapefile onto your map. Click ok on the unknown spatial reference. You should see something like the image on the next page(don’t worry about the grid just now). 9. We need to convert the dots to a line. Search for “points to line”( under data management in arctoolbox.) 10. Run points to line and choose the cross section points that you just added to the map. Accept default options and choose a desired save location. 11. The line is added to your map. 12. Choose a map scale that matches the map you have made. (i.e 1:10,000). 13. Adjust the extent of the data frame so that your line fits on and you have space to draw your geology. 14. Go to data frame properties>grids>Properties and adjust the Interval, labels etc. as desired. 15. Pan in the left hand side slightly so that the “0” label shows up on the x-axis. 16. Export the cross section as a pdf so that you can edit it in a graphics package.

