Menu
Lesson
Print
Name
Class
Skills Practice Lab
Date
DATASHEET FOR IN-TEXT LAB
How Will Our Population Grow?
If you were a demographer, you might be asked to determine how a population is
likely to change in the future. You have learned that the rate of population growth
is affected by both the number of children per family and the age at which people
have children. But which factor has a greater effect? To explore this question,
you will use age-structure diagrams—also called population pyramids.
OBJECTIVES
Predict which variable has a greater effect on population growth rates.
Calculate changes for a given population over a 50-year period.
Graph the resulting population’s age structure by creating a population pyramid.
Compare the effects of fertility variables on population growth rates.
MATERIALS
• calculator or computer
• colored pencils or markers
• graph paper
• notebook
• pen or pencil
• ruler
Procedure
1. In this lab you will calculate future population trends for an imaginary city. To
compare how fertility variables may affect population growth, each group of
students will test the effects of different assumptions. Assume the following
about the population of this city:
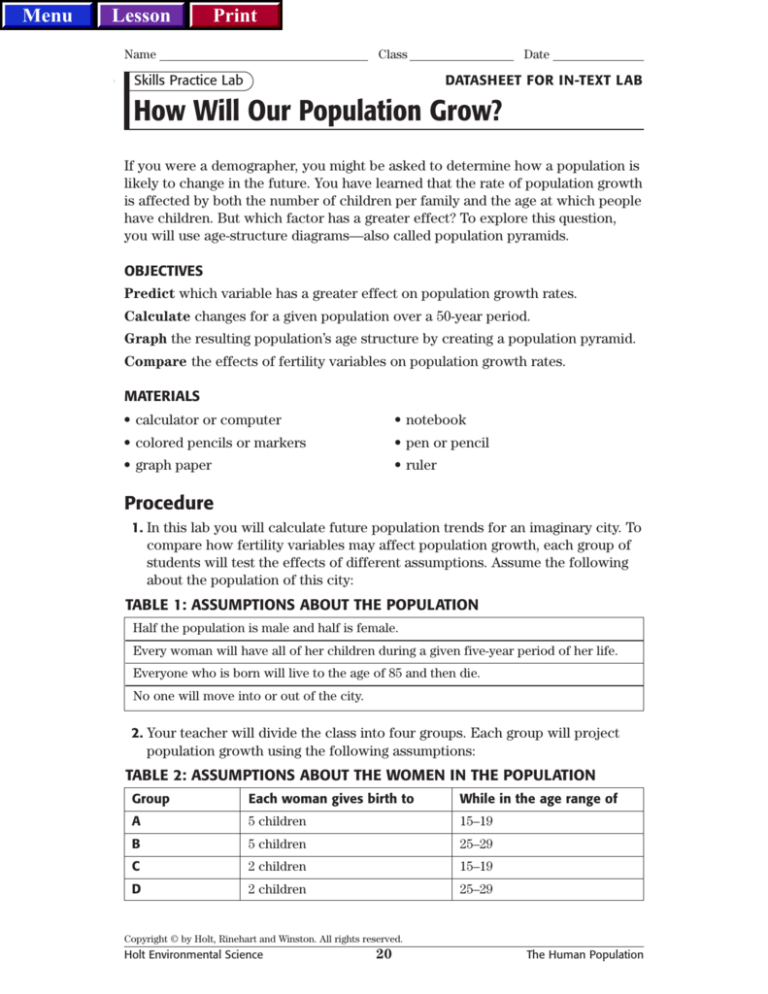
TABLE 1: ASSUMPTIONS ABOUT THE POPULATION
Half the population is male and half is female.
Every woman will have all of her children during a given five-year period of her life.
Everyone who is born will live to the age of 85 and then die.
No one will move into or out of the city.
2. Your teacher will divide the class into four groups. Each group will project
population growth using the following assumptions:
TABLE 2: ASSUMPTIONS ABOUT THE WOMEN IN THE POPULATION
Group
Each woman gives birth to
While in the age range of
A
5 children
15–19
B
5 children
25–29
C
2 children
15–19
D
2 children
25–29
Copyright © by Holt, Rinehart and Winston. All rights reserved.
Holt Environmental Science
20
The Human Population
ES04_CH09_055-058_LAB.qxd
Menu
12/13/02
Lesson
12:08 PM
Page 21
Print
Name
Class
Date
How Will Our Population Grow? continued
3. Predict which of the four groups will have the greatest population growth in
50 years. Write down the order you would predict for the relative size of the
groups from largest population to smallest population.
4. Table 3 shows the population of our imaginary city for the year 2000. Use the
data in the table to make an age-structure diagram (population pyramid) for
the city. Use the example diagram in your textbook to help you.
5. Calculate the number of 0- to 4-year-olds in the year 2005. To do this, first
determine how many women will have children between 2000 and 2005.
Remember that half of the population in each age group is female, and that
members of the population will reproduce at specific ages. Multiply the
number of child-bearing women by the number of children that each woman
will have. For example, Group A will have 12,500 new births by 2005.
TABLE 3: POPULATION IN EACH AGE GROUP, 2000–2050, GROUP _______
Age
2000
80+
1,100+
75–79
1,500
70–74
1,600
65–69
1,700
60–64
1,800
55–59
1,900
50–54
1,000
45–49
1,250
40–44
1,500
35–39
2,000
30–34
2,500
25–29
3,000
20–24
4,000
15–19
5,000
10–14
6,500
5–9
8,000
0–4
10,0001
Total
48,3501
2005
2010
2015
2020
2025
2030
2035
2040
2045
2050
Females
that give
birth
New
births
Note: Data shown above for Group A only.
Copyright © by Holt, Rinehart and Winston. All rights reserved.
Holt Environmental Science
21
The Human Population
ES04_CH09_055-058_LAB.qxd
Menu
12/13/02
Lesson
12:08 PM
Page 22
Print
Name
Class
Date
How Will Our Population Grow? continued
6. Fill in the entire column for the year 2005. Determine the number of people in
each age group by “shifting” each group from 2000. For example, the number
of 5- to 9-year-olds in 2005 will equal the number of 0- to 4-year-olds in 2000.
7. Calculate the total population for each five-year period.
8. Repeat the process described in steps 3–8 for each column, to complete Table
3 through the year 2050.
Analysis
1. Constructing Graphs Plot the growth of the population on a line graph. You
may want to use a computer to graph the results.
2. Constructing Graphs Make a population pyramid for the population in 2050.
Copyright © by Holt, Rinehart and Winston. All rights reserved.
Holt Environmental Science
22
The Human Population
ES04_CH09_055-058_LAB.qxd
Menu
12/13/02
Lesson
12:08 PM
Page 23
Print
Name
Class
Date
How Will Our Population Grow? continued
Conclusions
3. Evaluating Data Compare your graphs with the graphs of the other three
groups. Were your predictions correct?
4. Drawing Conclusions Which variable had a greater effect on population
growth—the number of children each woman had or the age at which each
woman had children?
5. Interpreting Information Did any of the groups show no growth in the
population? Explain these results.
Extension
1. From the age-structure diagram in your textbook, what would you predict to
happen to the U.S. population in the next 20 years? in the next 50 years? What
parts of the age structure are most important to these predictions?
Copyright © by Holt, Rinehart and Winston. All rights reserved.
Holt Environmental Science
23
The Human Population
Menu
Lesson
Print
TEACHER RESOURCE PAGE
Skills Practice Lab
DATASHEET FOR IN-TEXT LAB
How Will Our Population Grow?
Teacher Notes
TIME REQUIRED Two 45-minute class periods
SKILLS ACQUIRED
Constructing models
Identifying and recognizing patterns
Interpreting
Organizing and analyzing data
Predicting
RATING
Teacher Prep–1
Student Set-Up–2
Concept Level–3
Clean Up–1
Easy
1
2
Jennifer Seelig-Fritz
North Springs
High School
Atlanta, Georgia
3
4
Hard
THE SCIENTIFIC METHOD
Test the Hypothesis Procedure, steps 3–8
Analyze the Results Analysis, questions 1–2
Draw Conclusions Conclusions, questions 3–5
MATERIALS
The materials on the student page are enough for a group of 3 to 4 students.
You may want to set up a computer, if available, for the students to use to
graph their results.
MISCONCEPTION ALERT
To complete this lab, students must understand and accept the assumptions given
in step 2 of the procedure. Review these assumptions for each group of students.
Note that these assumptions are unrealistically simplified for the sake of modeling. Check that students are able to identify the variables being tested by each
different scenario (number of children/woman and age of reproduction).
Students may need extra help understanding how an age-structure diagram
is structured. Have students look closely at the example diagrams. Emphasize
the division between left and right for gender, and explain that each diagram
represents a cross-section of the population at a single point in time (for
example, one census year). Ask students questions about sample diagrams to
check understanding
Copyright © by Holt, Rinehart and Winston. All rights reserved.
Holt Environmental Science
53
The Human Population
Menu
Lesson
Print
TEACHER RESOURCE PAGE
How Will Our Population Grow? continued
TIPS AND TRICKS
Demonstrate the method of “moving up” age groups to fill in each new column in
the tables, and calculating new totals and births for each period of time. Use the
sample answers in the table as a starting point. Test student understanding of the
procedure by asking questions such as: “If there are 5,000 twenty- to twenty-fouryear-olds in the year 2010 and each woman in that age group has three children,
how many zero- to four-year-olds will there be in the year 2015?” (7,500). Students
may need extra help understanding age-structure diagrams.
Copyright © by Holt, Rinehart and Winston. All rights reserved.
Holt Environmental Science
54
The Human Population
Menu
Lesson
Print
TEACHER RESOURCE PAGE
Name
Class
Skills Practice Lab
Date
DATASHEET FOR IN-TEXT LAB
How Will Our Population Grow?
If you were a demographer, you might be asked to determine how a population is
likely to change in the future. You have learned that the rate of population growth
is affected by both the number of children per family and the age at which people
have children. But which factor has a greater effect? To explore this question,
you will use age-structure diagrams—also called population pyramids.
OBJECTIVES
Predict which variable has a greater effect on population growth rates.
Calculate changes for a given population over a 50-year period.
Graph the resulting population’s age structure by creating a population pyramid.
Compare the effects of fertility variables on population growth rates.
MATERIALS
• calculator or computer
• colored pencils or markers
• graph paper
• notebook
• pen or pencil
• ruler
Procedure
1. In this lab you will calculate future population trends for an imaginary city. To
compare how fertility variables may affect population growth, each group of
students will test the effects of different assumptions. Assume the following
about the population of this city:
TABLE 1: ASSUMPTIONS ABOUT THE POPULATION
Half the population is male and half is female.
Every woman will have all of her children during a given five-year period of her life.
Everyone who is born will live to the age of 85 and then die.
No one will move into or out of the city.
2. Your teacher will divide the class into four groups. Each group will project
population growth using the following assumptions:
TABLE 2: ASSUMPTIONS ABOUT THE WOMEN IN THE POPULATION
Group
Each woman gives birth to
While in the age range of
A
5 children
15–19
B
5 children
25–29
C
2 children
15–19
D
2 children
25–29
Copyright © by Holt, Rinehart and Winston. All rights reserved.
Holt Environmental Science
20
55
The Human Population
Menu
Lesson
Print
TEACHER RESOURCE PAGE
Name
Class
Date
How Will Our Population Grow? continued
3. Predict which of the four groups will have the greatest population growth in
50 years. Write down the order you would predict for the relative size of the
groups from largest population to smallest population.
Answers may vary.
4. Table 3 shows the population of our imaginary city for the year 2000. Use the
data in the table to make an age-structure diagram (population pyramid) for
the city. Use the example diagram in your textbook to help you.
5. Calculate the number of 0- to 4-year-olds in the year 2005. To do this, first
determine how many women will have children between 2000 and 2005.
Remember that half of the population in each age group is female, and that
members of the population will reproduce at specific ages. Multiply the
number of child-bearing women by the number of children that each woman
will have. For example, Group A will have 12,500 new births by 2005.
TABLE 3: POPULATION IN EACH AGE GROUP, 2000–2050, GROUP _______
Age
2000
2005
80+
1,100+
75–79
1,500
70–74
1,600
65–69
1,700
60–64
1,800
55–59
1,900
50–54
1,000
45–49
1,250
40–44
1,500
35–39
2,000
30–34
2,500
25–29
3,000
20–24
4,000
15–19
5,000
10–14
6,500
5–9
8,000
10,000
0–4
10,0001
12,500
Total
48,3501
Females
that give
birth
2,500
New
births
12,500
2010
2015
2020
2025
2030
2035
2040
2045
2050
Note: Data shown above for Group A only.
Copyright © by Holt, Rinehart and Winston. All rights reserved.
Holt Environmental Science
56
The Human Population
Menu
Lesson
Print
TEACHER RESOURCE PAGE
Name
Class
Date
How Will Our Population Grow? continued
6. Fill in the entire column for the year 2005. Determine the number of people in
each age group by “shifting” each group from 2000. For example, the number
of 5- to 9-year-olds in 2005 will equal the number of 0- to 4-year-olds in 2000.
7. Calculate the total population for each five-year period.
8. Repeat the process described in steps 3–8 for each column, to complete Table
3 through the year 2050.
Analysis
1. Constructing Graphs Plot the growth of the population on a line graph. You
may want to use a computer to graph the results.
2000
2. Constructing Graphs Make a population pyramid for the population in 2050.
The shape of age structure diagrams for groups A–D may vary.
Copyright © by Holt, Rinehart and Winston. All rights reserved.
Holt Environmental Science
57
The Human Population
Menu
Lesson
Print
TEACHER RESOURCE PAGE
Name
Class
Date
How Will Our Population Grow? continued
Conclusions
3. Evaluating Data Compare your graphs with the graphs of the other three
groups. Were your predictions correct?
The graphs should show population growth. Group A should have the
greatest population growth. Students should note whether or not their
original prediction was correct.
4. Drawing Conclusions Which variable had a greater effect on population
growth—the number of children each woman had or the age at which each
woman had children?
The number of children per woman had the greatest effect on population
growth. The age of reproduction was also important but had a lesser effect.
5. Interpreting Information Did any of the groups show no growth in the
population? Explain these results.
No. All groups showed some growth because the population started out
“bottom-heavy” and people were still having some children. Groups C and D
would eventually show zero growth.
Extension
1. From the age-structure diagram in your textbook, what would you predict to
happen to the U.S. population in the next 20 years? in the next 50 years? What
parts of the age structure are most important to these predictions?
If current trends continue, and without considering immigration, the U.S.
pyramid will become more evened out as current generations age. The
“bulge” of middle-aged people will move into older brackets (but eventually
shrink due to natural deaths). The lower levels will slowly get smaller relative to the upper levels, making the pyramid more “top-heavy.” Within 20
years, the age-structure will be somewhat evenly distributed. Within 50
years, the average person will be much older.
Copyright © by Holt, Rinehart and Winston. All rights reserved.
Holt Environmental Science
58
The Human Population

