to see a detailed breakdown of the following
advertisement
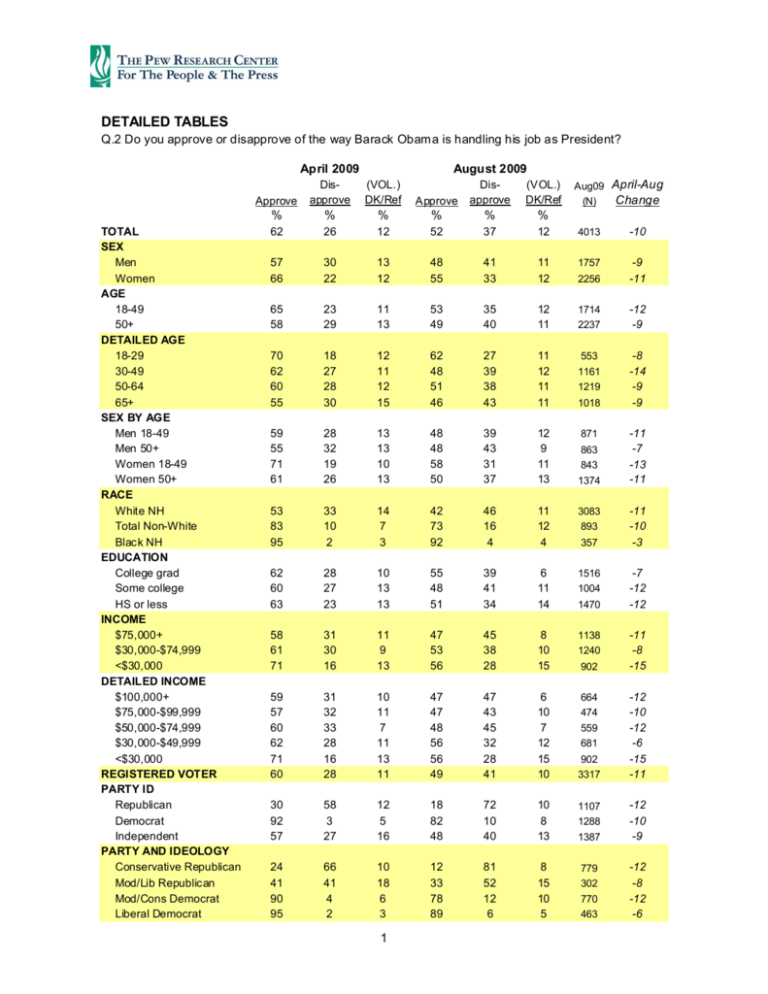
DETAILED TABLES Q.2 Do you approve or disapprove of the way Barack Obama is handling his job as President? April 2009 Approve TOTAL SEX Men Women AGE 18-49 50+ DETAILED AGE 18-29 30-49 50-64 65+ SEX BY AGE Men 18-49 Men 50+ Women 18-49 Women 50+ RACE White NH Total Non-White Black NH EDUCATION College grad Some college HS or less INCOME $75,000+ $30,000-$74,999 <$30,000 DETAILED INCOME $100,000+ $75,000-$99,999 $50,000-$74,999 $30,000-$49,999 <$30,000 REGISTERED VOTER PARTY ID Republican Democrat Independent PARTY AND IDEOLOGY Conservative Republican Mod/Lib Republican Mod/Cons Democrat Liberal Democrat Disapprove August 2009 (VOL.) DK/Ref Approve Disapprove (VOL.) DK/Ref Aug09 April-Aug Change (N) % % % % % % 62 26 12 52 37 12 4013 -10 57 66 30 22 13 12 48 55 41 33 11 12 1757 2256 -9 -11 65 58 23 29 11 13 53 49 35 40 12 11 1714 2237 -12 -9 70 62 60 55 18 27 28 30 12 11 12 15 62 48 51 46 27 39 38 43 11 12 11 11 553 1161 1219 -8 -14 -9 -9 59 55 71 61 28 32 19 26 13 13 10 13 48 48 58 50 39 43 31 37 12 9 11 13 53 83 95 33 10 2 14 7 3 42 73 92 46 16 4 11 12 4 3083 893 62 60 63 28 27 23 10 13 13 55 48 51 39 41 34 6 11 14 1516 1004 58 61 71 31 30 16 11 9 13 47 53 56 45 38 28 8 10 15 1138 1240 59 57 60 62 71 60 31 32 33 28 16 28 10 11 7 11 13 11 47 47 48 56 56 49 47 43 45 32 28 41 6 10 7 12 15 10 664 474 30 92 57 58 3 27 12 5 16 18 82 48 72 10 40 10 8 13 1107 1288 24 41 90 95 66 41 4 2 10 18 6 3 12 33 78 89 81 52 12 6 8 15 10 5 779 302 1 1018 871 863 843 1374 357 1470 902 559 681 902 3317 1387 770 463 -11 -7 -13 -11 -11 -10 -3 -7 -12 -12 -11 -8 -15 -12 -10 -12 -6 -15 -11 -12 -10 -9 -12 -8 -12 -6 DETAILED TABLES Q.2 Do you approve or disapprove of the way Barack Obama is handling his job as President? April 2009 RELIGIOUS PREFERENCE Total White NH Prot. White NH evang. Prot. White NH mainline Prot. Total Catholic White NH Cath. Unaffiliated CHURCH ATTENDANCE More than once a week Once a week Once or twice a month A few times a year Seldom/Never REGION Northeast Midwest South West MARITAL STATUS Married Not married MARITAL STATUS BY SEX Married men Married women Unmarried men Unmarried women EMPLOYMENT Employed Not employed AMONG REPUBLICANS Men Women 18-49 50+ AMONG DEMOCRATS Men Women 18-49 50+ AMONG INDEPENDENTS Men Women 18-49 50+ August 2009 Aug09 April-Aug Change (N) Approve Disapprove (VOL.) DK/Ref Approve Disapprove (VOL.) DK/Ref % % % % % % 45 34 57 66 55 76 40 50 28 22 31 13 15 16 15 12 13 11 34 28 42 55 50 60 53 60 45 35 42 27 12 12 13 10 9 12 49 56 64 66 70 40 32 24 21 17 11 12 12 12 13 38 47 55 56 58 50 43 34 33 29 12 10 11 11 13 70 60 58 63 20 26 29 25 10 14 12 12 55 51 50 53 34 37 39 36 11 12 11 12 773 1029 55 69 34 18 12 13 46 58 44 29 11 13 2217 50 60 65 72 39 28 20 16 12 12 14 12 43 48 54 62 48 40 33 26 9 12 13 12 1000 1217 62 62 27 23 11 14 50 53 38 35 12 11 2222 28 31 31 29 59 57 57 58 13 12 12 13 19 17 18 18 73 70 70 74 7 13 12 8 500 607 92 92 92 91 4 3 3 4 4 5 5 4 84 81 84 79 9 10 9 11 7 9 7 10 442 54 61 63 49 31 22 23 32 16 17 14 19 43 54 50 43 44 34 36 46 13 12 13 11 725 2 1721 914 807 883 668 588 626 1037 620 680 1005 1496 715 1772 748 1024 1762 452 642 846 505 766 662 665 700 -11 -6 -15 -11 -5 -16 -11 -9 -9 -10 -12 -15 -9 -8 -10 -9 -11 -7 -12 -11 -10 -12 -9 -9 -14 -13 -11 -8 -11 -8 -12 -11 -7 -13 -6 DETAILED TABLES Q.2 Do you approve or disapprove of the way Barack Obama is handling his job as President? April 2009 August 2009 Approve Disapprove (VOL.) DK/Ref Approve Disapprove (VOL.) DK/Ref % % % % % % 48 57 54 52 62 53 45 56 57 51 53 54 58 27 89 50 36 29 32 34 26 31 39 31 31 33 35 36 24 60 5 31 15 14 14 15 12 16 16 12 12 16 12 10 18 13 6 19 39 45 42 43 46 46 37 44 48 40 43 43 44 15 78 41 51 42 46 46 43 42 51 45 45 47 50 47 39 76 12 47 10 13 12 11 11 12 11 11 6 14 7 11 17 9 9 12 AMONG WHITES Men Women 18-49 50+ Northeast Midwest South West College grad Some college or less $75,000+ $30,000-$74,999 <$30,000 Republican Democrat Independent Aug09 April-Aug Change (N) 1315 1768 1180 1857 622 878 1066 517 1248 1822 973 951 610 990 833 1107 -9 -12 -12 -9 -16 -7 -8 -12 -9 -11 -10 -11 -14 -12 -11 -9 ABOUT THE SURVEYS August results are based on telephone interviews conducted among a nationwide sample of 4,013 adults, 18 years of age or older from August 11-27, 2009 (3,012 respondents were interviewed on a landline telephone, and 1,001 were interviewed on a cell phone, including 347 who had no landline telephone). For the total sample, the margin of error attributable to sampling that would be expected at the 95% level of confidence is plus or minus 2 percentage points. The margin of error for subgroups will be higher. April results are based on telephone interviews conducted among a nationwide sample of 3,013 adults, 18 years of age or older, from March 31-April 21, 2009. (2,260 respondents were interviewed on a landline telephone, and 753 were interviewed on a cell phone, including 271 who had no landline telephone). For the total sample, the margin of error attributable to sampling that would be expected at the 95% level of confidence is plus or minus 2 percentage points. The margin of error for subgroups will be higher. Both surveys were conducted under the direction of Princeton Survey Research Associates International and interviews were conducted in English and Spanish. Both the landline and cell phone samples were provided by Survey Sampling International. For detailed information about our survey methodology, see http://peoplepress.org/methodology/. 3
