Flow in an Orifice Meter
advertisement
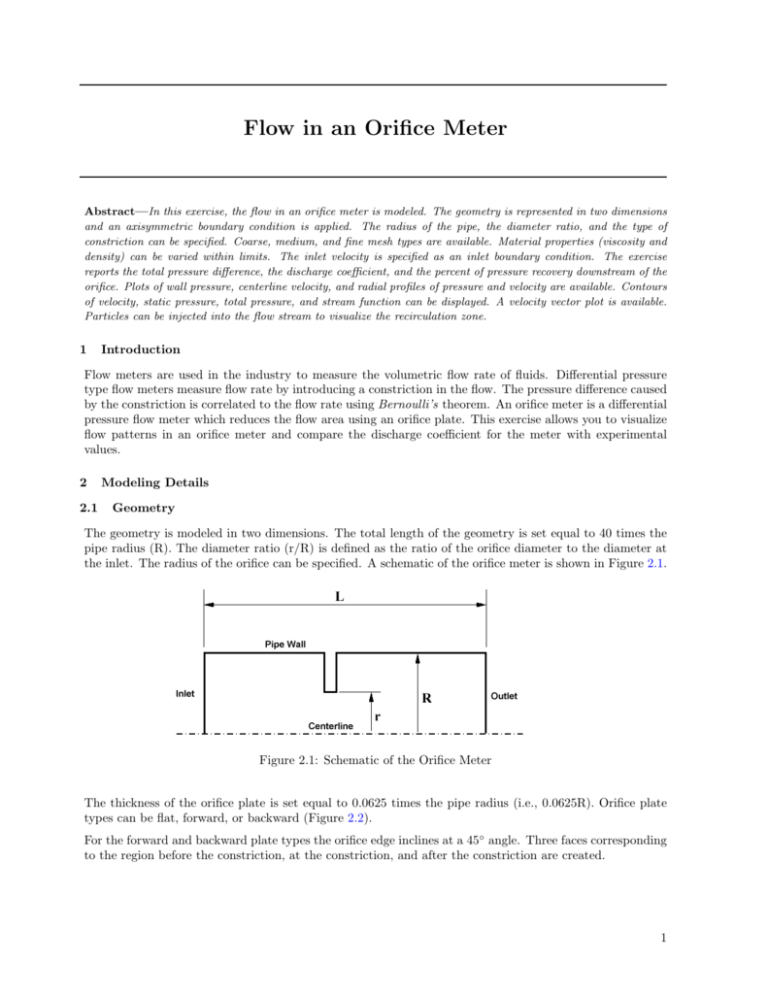
Flow in an Orifice Meter Abstract—In this exercise, the flow in an orifice meter is modeled. The geometry is represented in two dimensions and an axisymmetric boundary condition is applied. The radius of the pipe, the diameter ratio, and the type of constriction can be specified. Coarse, medium, and fine mesh types are available. Material properties (viscosity and density) can be varied within limits. The inlet velocity is specified as an inlet boundary condition. The exercise reports the total pressure difference, the discharge coefficient, and the percent of pressure recovery downstream of the orifice. Plots of wall pressure, centerline velocity, and radial profiles of pressure and velocity are available. Contours of velocity, static pressure, total pressure, and stream function can be displayed. A velocity vector plot is available. Particles can be injected into the flow stream to visualize the recirculation zone. 1 Introduction Flow meters are used in the industry to measure the volumetric flow rate of fluids. Differential pressure type flow meters measure flow rate by introducing a constriction in the flow. The pressure difference caused by the constriction is correlated to the flow rate using Bernoulli’s theorem. An orifice meter is a differential pressure flow meter which reduces the flow area using an orifice plate. This exercise allows you to visualize flow patterns in an orifice meter and compare the discharge coefficient for the meter with experimental values. 2 2.1 Modeling Details Geometry The geometry is modeled in two dimensions. The total length of the geometry is set equal to 40 times the pipe radius (R). The diameter ratio (r/R) is defined as the ratio of the orifice diameter to the diameter at the inlet. The radius of the orifice can be specified. A schematic of the orifice meter is shown in Figure 2.1. Figure 2.1: Schematic of the Orifice Meter The thickness of the orifice plate is set equal to 0.0625 times the pipe radius (i.e., 0.0625R). Orifice plate types can be flat, forward, or backward (Figure 2.2). For the forward and backward plate types the orifice edge inclines at a 45◦ angle. Three faces corresponding to the region before the constriction, at the constriction, and after the constriction are created. 1 Figure 2.2: Orifice Plate Types 2.2 Mesh Coarse, medium, and fine mesh types are available. Mesh density varies based upon the assigned Refinement Factor. The Refinement Factor values for the mesh densities are given in Table 2.1. Mesh Density Fine Medium Coarse Refinement Factor 1 1.6 2.56 Table 2.1: Refinement Factor Using the Refinement Factor, First Cell Height is calculated with the following formula: F irst Cell Height = Ref inement F actor Y plus × (Characteristic Length0.125 × V iscosity 0.875 ) (0.199 × V elocity 0.875 × Density 0.875 ) (2-1) Reynolds number based upon pipe diameter is used to determine Yplus. Yplus values for turbulent flow conditions are summarized in Table 2.2. Reynolds Number Re < 1000 1000 ≤ Re ≤ 100000 Re > 100000 Flow Regime Laminar Turbulent, Enhanced Wall Treatment Turbulent, Standard Wall Functions Yplus/First Cell Height First Cell Height = Pipe Radius/100 Yplus < 10 Yplus > 30 Table 2.2: Flow Regime Vs. Reynolds Number The number of intervals along each edge is determined using geometric progression and the following equation: Intervals = IN T Log n Edge length×(Growth ratio−1) F irst Cell Height Log(Growth ratio) o + 1.0 (2-2) The edges are meshed using the First Cell Height and the calculated number of intervals. The entire domain is meshed using a map scheme. The resulting mesh is shown in Figure 2.3. 2 c Fluent Inc. [FlowLab 1.2], January 6, 2005 Figure 2.3: Mesh Generated by FlowLab 2.3 Physical Models for FLUENT Based on the Reynolds number, the following physical models are recommended: Re < 1000 1000 ≤ Re ≤ 2000 Re > 2000 Laminar flow Low Reynolds number k − model k − model Table 2.3: Turbulence Models Based on Pipe Reynolds Number If turbulence is selected in the Physics form of the Operation menu, the appropriate turbulence model and wall treatment is applied based upon the Reynolds number. 2.4 Material Properties The following material properties of the fluid can be specified: • Density • Viscosity 2.5 Boundary Conditions Inlet fluid velocity can be specified. The following boundary conditions are assigned in FLUENT: Boundary Inlet Outlet Centerline Pipe-Wall Assigned As Velocity inlet Pressure outlet Axis Wall Table 2.4: Boundary Conditions Assigned in FLUENT c Fluent Inc. [FlowLab 1.2], January 6, 2005 3 2.6 Solution Axial positions can be specified to plot velocity and pressure profiles. The orifice discharge coefficient is determined by measuring the pressure difference between the upstream tap and the vena contracta, which is the position of maximum velocity. These values are calculated as: upstream tap = 0.5L − 12× plate thickness vena contracta = 0.5L + 1.0× plate thickness The mesh is exported to FLUENT along with the physical properties and the initial conditions specified. The material properties and the initial conditions are read through the case file. Instructions for the solver are provided through a journal file. When the solution is converged or the specified number of iterations is met, FLUENT exports data to a neutral file and to .xy plot files. GAMBIT reads the neutral file for postprocessing. 3 Scope and Limitations This exercise accurately predicts the discharge coefficient between Reynolds numbers of 10 to 320,000, although a prediction error of five percent or more exists for the Reynolds number range of 1,000 to 2,000 because of transitional aspects of the flow. Difficulty in obtaining convergence or poor accuracy may result if input values are used outside the upper and lower limits suggested in the problem overview. 4 4.1 Exercise Results Reports The following reports are available: • Total pressure difference • Discharge coefficient • Pressure recovery (in %) • Mass imbalance 4.2 XY Plots The plots reported by FlowLab include: • Residuals • Pressure distribution on the wall • Centerline velocity distribution • Radial profiles of static pressure at specified positions • Radial profiles of velocity at specified positions • Wall Yplus distribution * * Available only when the flow is modeled as turbulent. 4 c Fluent Inc. [FlowLab 1.2], January 6, 2005 Figure 4.1 represents radial profiles of axial velocity at various axial positions. Figure 4.1: Radial Profiles of Axial Velocity for Re = 40000 4.3 Contour Plots Contour plots of pressure, total pressure, stream function, velocity magnitude, axial velocity, and radial velocity are available. In addition velocity vectors can be displayed. Contours of static pressure are presented in Figure 4.2. Figure 4.2: Contours of Static Pressure for Re = 40000 c Fluent Inc. [FlowLab 1.2], January 6, 2005 5 5 Verification of Results Table 5.1 represents the predicted discharge coefficients versus Reynolds number. These results were obtained using a radius of 0.1 m, a diameter ratio of 0.5, the flat orifice type, and the fine mesh option. Re 10 100 500 1000 4000 40000 32000 FlowLab 0.4465 0.6909 0.7164 0.6937 0.6396 0.6566 0.6488 Discharge Coefficient Experimental Correlation[1] 0.43 0.69 0.75 0.7 0.65 0.63 0.63 Table 5.1: Predicted Discharge Coefficient Vs. Reynolds Number 6 Sample Problems 1. Run the exercise using the default settings and check the predicted value of discharge coefficient. Compare with literature. 2. Run additional cases while decreasing the diameter ratio to determine how pressure recovery and the discharge coefficient varies with Reynolds number and diameter ratio. Compare predicted results with literature. 7 Reference [1] Perry’s Chemical Engineering Handbook. 8 Authors 1. Ashish Kulkarni Fluent India Pvt. Ltd. Pune, India kaa@fluent.co.in 2. Shane Moeykens Fluent Inc. Lebanon, New Hampshire, USA sam@fluent.com 6 c Fluent Inc. [FlowLab 1.2], January 6, 2005
