Soil Mechanics Laboratory
advertisement
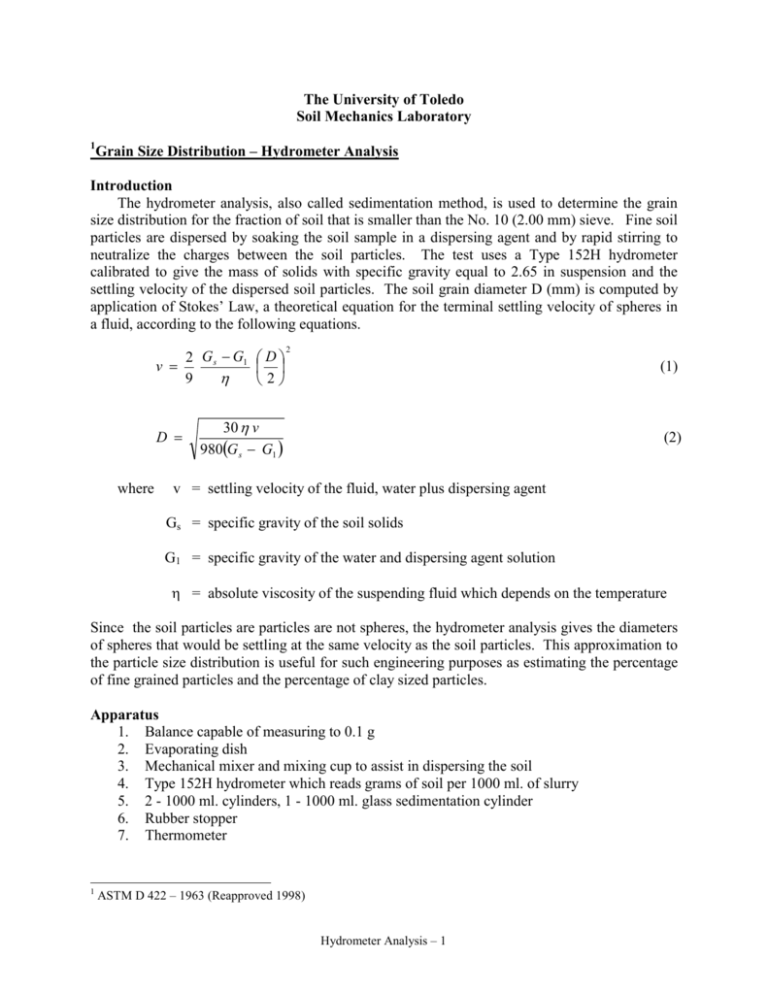
The University of Toledo Soil Mechanics Laboratory 1 Grain Size Distribution – Hydrometer Analysis Introduction The hydrometer analysis, also called sedimentation method, is used to determine the grain size distribution for the fraction of soil that is smaller than the No. 10 (2.00 mm) sieve. Fine soil particles are dispersed by soaking the soil sample in a dispersing agent and by rapid stirring to neutralize the charges between the soil particles. The test uses a Type 152H hydrometer calibrated to give the mass of solids with specific gravity equal to 2.65 in suspension and the settling velocity of the dispersed soil particles. The soil grain diameter D (mm) is computed by application of Stokes’ Law, a theoretical equation for the terminal settling velocity of spheres in a fluid, according to the following equations. v = D = where 2 G s - G1 æ D ö ç ÷ h 9 è2ø 2 (1) 30 h v 980(G s - G1 ) (2) v = settling velocity of the fluid, water plus dispersing agent Gs = specific gravity of the soil solids G1 = specific gravity of the water and dispersing agent solution h = absolute viscosity of the suspending fluid which depends on the temperature Since the soil particles are particles are not spheres, the hydrometer analysis gives the diameters of spheres that would be settling at the same velocity as the soil particles. This approximation to the particle size distribution is useful for such engineering purposes as estimating the percentage of fine grained particles and the percentage of clay sized particles. Apparatus 1. Balance capable of measuring to 0.1 g 2. Evaporating dish 3. Mechanical mixer and mixing cup to assist in dispersing the soil 4. Type 152H hydrometer which reads grams of soil per 1000 ml. of slurry 5. 2 - 1000 ml. cylinders, 1 - 1000 ml. glass sedimentation cylinder 6. Rubber stopper 7. Thermometer 1 ASTM D 422 – 1963 (Reapproved 1998) Hydrometer Analysis – 1 Procedure A. Preparation (at least 24 hours before test) 1) Prepare a solution of sodium hexametaphosphate mixed at the rate 40 g of sodium hexametaphosphate per liter of solution. 2) Weigh out a sample of 50.0 g of oven-dried soil (Ws). Hydrometer sample should be finer than the No. 10 sieve. The mass of oven-dried soil must be divided by the percent passing the No. 10 sieve if the sample includes sizes larger than the No. 10 sieve. Place the soil in an evaporating dish and cover with 125 ml of the sodium hexametaphosphate solution. Allow soaking for at least 16 hours. 3) Prepare one cylinder with 125 ml of solution and enough water to bring the solution to 1000 ml. This is the control solution used to get the zero correction. Prepare another cylinder with 1000 ml of water to provide a supply of room temperature water. B. Laboratory 1) Practice placing the hydrometer in the control solution so that the hydrometer will not move up and down after releasing it. This is done by lowering the hydrometer water level to about zero on the hydrometer stem, which corresponds to zero grams of solids per 1000 ml of solution. Practice taking readings of the top of the meniscus formed on the stem of the hydrometer. The reading in the control solution is the zero correction, Cz. When taking readings in the soil-water suspension, estimate the hydrometer reading before placing the hydrometer in the suspension. The reading will be less than 50 initially and will decrease as soil settles out of solution. 2) Transfer the soil-water slurry to the dispersion cup making sure that all soil is washed from the dish. If necessary, add enough water to the slurry so that the cup is more than half full. Stir with the mechanical mixer for a period of 1 minute. 3) Immediately after dispersion, transfer the soil slurry into the glass sedimentation cylinder making sure that all soil is washed from the mixer and the dispersion cup. Add enough water to fill the cylinder to the 1000-ml mark. 4) Use a stopper or the palm of the hand to cover the end of the cylinder. Turn the cylinder upside down and back for 1 minute at a rate of 30 times per minute to agitate the mixture. Place the cylinder in a convenient place on the counter where it will not be disturbed. Start timing immediately. 5) Obtain the hydrometer readings using the top of the meniscus on the hydrometer. Obtain 2 readings within the first 2 minutes recording the actual times of the readings. Recommended times for additional readings are: 2, 5, 15, 30, 60, 250, and 1440 minutes. Record the actual time of readings, if readings are taken at other times. 6) After the 2-minute reading, remove the hydrometer from the soil suspension after each reading. Place the hydrometer in the control solution with a spinning motion. 7) Obtain the temperature of the slurry (or the control solution) after each reading. Hydrometer Analysis – 2 Calculations For Type 152H hydrometers, the velocity v is equal to L/T, and Equation 2 is written as D = K L /T where (3) K = a constant depending on the specific gravity of the solids and the temperature of the fluid (mm x (min/cm)1/2), given in the Table 1; L = effective depth in cm. of the hydrometer which is the distance from the surface of the suspension to the center of the hydrometer bulb (cm); T = elapsed time (min). For Type 152H hydrometers, the effective depth can be given as L = 16.3 – 0.164 R (4) where R is the reading on the hydrometer in grams of solids per liter of suspension. The effective depth is the distance that the soil has settled that can then be used to calculate velocity. The equation for the percentage of the soil remaining in suspension is P = (Rc a / M s) x 100% (5) Rc = Actual hydrometer reading - zero correction, Cz + temperature correction, CT (6) where the zero correction is obtained as described in laboratory step (1) above and CT, given in the Table 1, is a factor that accounts for variation in the density of the soil-water suspension for different temperatures. a = correction factor required when the specific gravity of the soil grains is not equal to 2.65 and given by the following equation 1.65 Gs 2.65 (Gs - 1) M s = oven dry mass in g of the soil sample dispersed in preparation step (2). a= Results Complete the Table 2 on the next page using Equations 3 though 7 and temperature dependent constants provided in Table 1. The grain size distribution is plotted on Figure 1, since the particle diameter and percent of soil in suspension, equivalent to the percent finer, are computed. Hydrometer Analysis – 3 (7) Table 1 – Temperature Dependent Fluid Constants K (ASTM Type 152H Hydrometer) Temperature o C 16 17 18 19 20 21 22 23 24 25 26 27 28 29 30 CT -0.90 -0.70 -0.50 -0.30 0.00 +0.20 +0.40 +0.70 +1.00 +1.30 +1.65 +2.00 +2.50 +3.05 +4.80 2.60 0.0146 0.0144 0.0142 0.0140 0.0139 0.0137 0.0135 0.0134 0.0132 0.0131 0.0129 0.0128 0.0126 0.0125 0.0124 Specific Gravity of Soil, Gs 2.65 2.70 0.0144 0.0141 0.0142 0.0140 0.0140 0.0138 0.0138 0.0136 0.0137 0.0134 0.0135 0.0133 0.0133 0.0131 0.0132 0.0130 0.0130 0.0128 0.0129 0.0127 0.0127 0.0125 0.0126 0.0124 0.0124 0.0123 0.0123 0.0121 0.0122 0.0120 2.75 0.0139 0.0138 0.0136 0.0134 0.0133 0.0131 0.0129 0.0128 0.0126 0.0125 0.0124 0.0122 0.0121 0.0120 0.0118 Table 2 – Calculation Sheet for Hydrometer Analysis Hydrometer Analysis Group __________ Soil Description Oven Dry Soil Mass, M s Specific Gravity, Gs Zero Correction, Cz Specific Gravity Correction, a Elapsed Hydrometer Time Reading Temp. L min R (oC) (K) (cm) D (mm) 2 5 15 30 60 Hydrometer Analysis – 4 CT Date _________ Corrected Reading, Rc Percent Finer, P 100% Percent Finer 80% 60% 40% 20% 0% 1.000 0.100 0.010 0.001 Particle Diameter, mm Figure 1 – Grain Size Distribution of Fine-Grained Soil Conclusions Is the grain size distribution curve representative of the type of soil tested in the laboratory? How would it affect the results if the test were conducted when the temperature was 5o C higher? What is the percent finer than the # 200 sieve (0.075 mm) and the percent finer than 0.002mm (clay particles)? What correction would be required if the soil was first sieved and it was determined that the hydrometer sample included only 60% of the total soil sample, i. e. the other 40% was larger in diameter than any of the grain diameters measured? Hydrometer Analysis – 5 1000-ml Cylinders Hydrometer Thermometer And Timer Rubber Stopper Picture 1 – !000-ml Cylinders and Hydrometer Mixer and Mixing Cup Evaporating Dish Picture 2 – Mixer and Mixing Cup Hydrometer Analysis – 6
