Document
advertisement

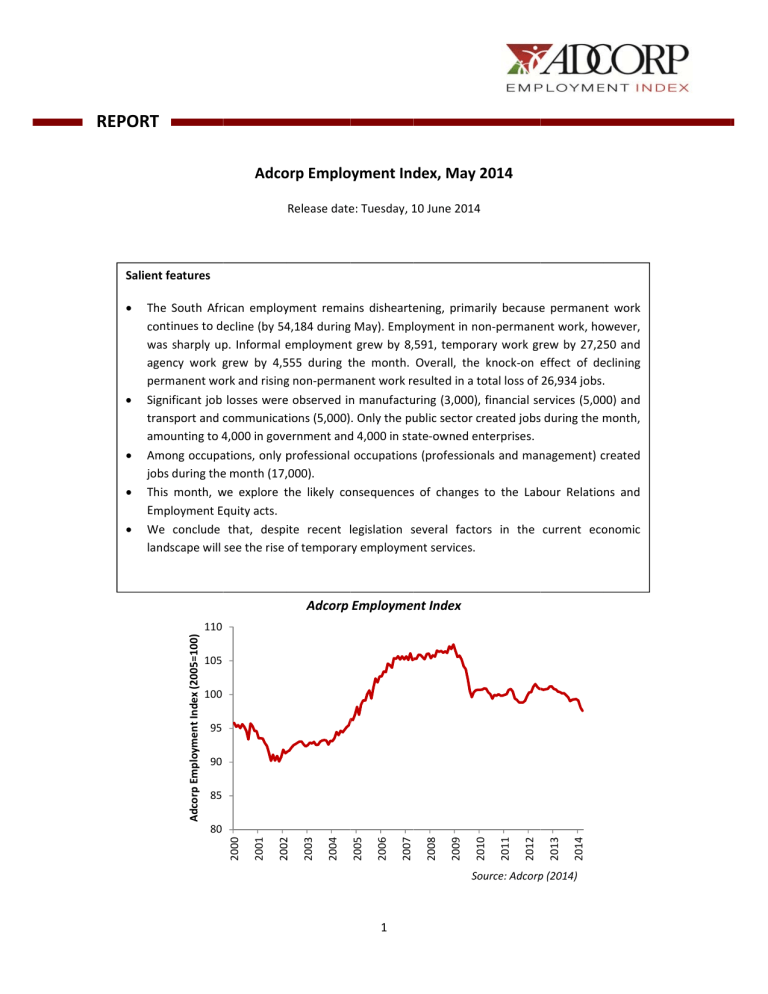
REPORT Adco orp Emplo oyment Ind dex, May 2014 Release date e: Tuesday, 10 1 June 2014 4 Salientt features Adcorp Employment Index 110 105 100 95 90 85 2014 2013 2012 2011 2010 2009 2008 2007 2006 2005 2004 80 2003 2002 2001 2000 e permanent work The South African employyment remains dishearteening, primaarily because 4,184 duringg May). Employment in non-permane n ent work, ho owever, continues to decline (by 54 waas sharply up p. Informal employment e t grew by 8,591, temporary work grrew by 27,25 50 and agency work grew g by 4,5 555 during the t month. Overall, thee knock-on effect of deeclining peermanent wo ork and risingg non-permaanent work reesulted in a total t loss of 26,934 jobs.. Siggnificant job losses weree observed in n manufactu uring (3,000), financial seervices (5,00 00) and traansport and communicat c tions (5,000). Only the pu ublic sector created c jobs during the month, m am mounting to 4,000 4 in goveernment and d 4,000 in staate-owned enterprises. e Am mong occupaations, only professional p occupationss (profession nals and man nagement) created c job bs during thee month (17,,000). This month, we w explore the t likely co onsequencess of changess to the Lab bour Relations and Em mployment Equity acts. Wee conclude that, despite recent legislation l s several facto ors in the current eco onomic lan ndscape will see the rise of temporarry employmeent services. Adcorp Employment Index (2005=100) Source: Adcorp p (2014) 1 REPORT Anaalysis: Usee of temporary worrkers conttinues to grow, g desspite legislation e of the anom malies of the past few years is that teemporary em mployment co ontinues to grow, g despitte legislation that One is intended either to reducee the use of tempory wo orkers or raisse the employment costt of temporaary workers. (For addiitional inform mation on the t legislativve changes, please referr to April’s Adcorp A Emp ployment Ind dex.) In Adco orp’s dataabases for th he past 17 months m sincee January 201 13, the num mber of blue--collar tempo orary workers has witneessed an increase from m 65,256 to 69,732 – an n increase off 6.9%. Betw ween April an nd May, thee number inccreased by 5,254 5 workers (or 6.3% % month-on n-month, to say nothingg about the annualised increase thaat this repreesents of 73..6%). White-collar tem mps, by contrast, shrankk 5.6% sincee January 20 013 and white-collar pe ermanent wo orkers shran nk by 7.5% % in month-o on-month terms between n April and May M alone. The case againstt permanentt work is cleaar to establissh and is besst illustrated by a chart which w is mon nitored close ely at Adco orp, namely the percenttage deviatio on from tren nd of our permanent reccruitment bu usinesses. Ass may be see en in the figure, f perm manent work measured in n this way is close to the all-time low reached in September S 2 2009 during what w is no ow called thee ‘Great Rece ession’. Figure. Permanentt Recruitmen nt: Deviation n from Linearr Trend (1997-2014) Percentage deviation from trend (%) 50% 40% 30% 20% 10% 0% -10% -20% -30% -40% Percentage deviation from lineaar trend Source: Adcorp A Holdingss (2014) Whyy does there appear to be b a structurral shift in the labour maarket whereb by mostly blu ue-collar perrmanent worrkers are being outso ourced to em mployment aagencies such as Adcorp p? The first part p of the answer a is th hat South African firms are utilisin ng temporaryy blue-collar workers in their t expansion strategiees in the restt of Africa. Work W occurring in Africca outside So outh Africa now n accountts for 9.5% of Adcorp’s headcount an nd this figure e is growing sharply, s by 126% 1 overr the past three 2 The second partt of the answ wer is that South S Africaan manufacturing firms are a continuing to outsource their entryleve elREPORT positions, w which they are a still allow wed to do un nder the new w labour law ws. Of these manufacturiing firms, 65 5% of emp ploy less than 50 people e and 45% employ e less than t five peeople. , the latter accoun nting for jusst 12% (or 1 in 8 workers) of the private secto or workforcee. ntry-level blu ue-collar wo orkforces do not consist of a mix off permanentt and tempo orary The third answeer is that en workers, which allows comp panies to deefer or ignorre the new ‘‘equal pay fo or work of equal e value’ provision in n the Emp ployment Equ uity Act, as there t are no permanent worker w comparisons for equal pay pu urposes. How wever, the caase for outso ourcing a blue-collar wo orkforce is growing in atttractivenesss, not only in n manufactu uring, but throughout the econom my. Temps no ow account for 992,306 workers or 9.8% of the entire privaate sector fo ormal workforce and 2 25.4% of the e national teemporary workforce. In some secto ors, such as manufacturing, the figu ure is subsstantially higgher (around d 33.6% of the manufacturing workforce), butt temporary work in general – wheether thro ough agenciees or not – is a growingg phenomen non, with 3,901,254 workers repressenting 31.1% of the offficial sector workforcee. The case for tem mporary stafffing, particularly blue-colllar workers,, is strong, co onsisting of the t followingg dimensionss: The mo odern econo omy. In a global econo omy, sales aare highly unpredictablee. Companiees win and lose contractts under fierrcely compettitive conditions. South Africa A is parrticularly vuln nerable to competitors from f low-wagge countries such as Brazzil, China and d India. When sales are highly h unpred dictable, it iss impossible for a firm to ccarry a fixed,, permanentt staff complement – it needs to varyy its labour fo orce in real ttime to matcch its volume of sales an nd productio on. Temporaary staff alllow for thiss level of fle exibility. In addition to this, seasonality has beco ome ever mo ore pronoun nced in todayy’s modern economy. Cyycles are no longer just local but glob bal. Economic conditionss in the major developeed (consumin ng/importingg) countries have a dram matic effect on n local produ uction and saales conditio ons. Bearing this in mind,, temporary staff allow for f a high levvel of flexibility, particularly in the manufacturing, mining, constructio on and tran nsport secto ors which make m significant use of flexible staff. Outsourrcing non-core activities.. A companyy’s workforcee was once considered c a key comparrative advanttage. Today’s economic climate seees more and more com mpanies vieewing their labour forcces as non--core compon nents of their business model. m This iss particularlyy true at the lower end of o the skills spectrum, s w where the labo our market is highly competitive. c There is, however, h also a trend to outsourrcing high-skkilled occupations too, including info ormation tecchnology, leggal services,, financial back-offices, b and so on. The outsourccing of high--skilled profeessionals is not being drriven by com mpanies alon ne, but also by professio onals themselves, who seeek greater degrees d of work-life w balance and working w optio ons such as flexible worrking hours, ttime off, sabbaticals, and the like. These tem mporary worrkers – who o prefer to call themse elves ‘contracctors’ or ‘lifesstyle workerrs’– are drivin ng a new patttern of work that will grradually perccolate downw ward through the ranks of organisatio ons. This is driving the usse of temporrary workerss, particularlyy those managed through agencies, which w assumee total respo onsibility forr the human capital valu ue chain from m recruitmen nt to payroll aand performance management. 3 Flexible office hourss. Where, on nce, businesses kept office hours that suited theeir workers – i.e. Mondaay to Friday fr rom 8.00am to 5.00pm – more and more businesses are be eing organise ed around th heir customeers – REPORT i.e. weekend operations, early opening o and late closing, as well as sttaffing at higgher levels during peak hours h such as lunch-timess and near closing times. More an nd more bu usinesses are e also facin ng fixed-duraation projectss, with annuity income proving to be e a challengee for compan nies. These fiixed-term co ontracts are ideal for flexib ble workers, with their use growing as a a result. Restrictiive labour la aws. There iss no doubt th hat restrictivve labour law ws in South Africa A have eencouraged firms f to applyy innovative methods and d clever com mmercial con ntracting to engage e workkers. There are many variants on the o outsourcing theme: t companies can employ e temp porary workeers themselvves (the ‘direect’ model); they can employ temporary workerrs through dedicated d em mployment agencies (th he so-called ‘agency’ model m known aas Temporarry Employmeent Services in the Labou ur Relations Act); compaanies can inssert various legal structures between themselvess and the employees (including thee so-called ‘Managed Service S Proviider” model th hat has provved incrediblyy popular in developed countries); c among other methods. The upshot of tthe analysis is that bluee-collar temporary stafffing, particullarly through h employmeent agenciess will w strongly in nto the futurre. Permanen nt employmeent is in outrright decline, and our mo odelling sugggests conttinue to grow thatt permanent employmen nt will only grow g sufficien ntly to absorrb school-leaavers when economic e growth rises to o 4% of more m per annum, and will w only grow w sufficientlyy to reintegrrate informaal sector wo orkers into th he formal seector whe en economicc growth rises above 8% % per annum m – neitherr of which iss in prospecct for at leaast several years y Tem mporary stafffing (particularly the ‘agency’ model) is likely to o grow irresp pective of th he rate of ecconomic gro owth: therre are good reasons, r as listed above,, why blue-co ollar workers are being outsourced o i growing numbers. Adccorp, in with h a strong preesence in So outh Africa an nd a market--leading pressence in the rest of Africaa, Add ditional Data D ployment byy Type Emp Type e Uno official sectorr Officcial sector Tyypical (permaanent, full-time) Attypical (temp porary, part--time) - of which aggencies Totaal * An nnualized Emp ployment Maay 2014 6,,499,803 12,,541,583 8,,640,329 3,,901,254 992,306 19,,041,386 Percentage P c change vs. A 2014* Apr 1.59 -2.57 -7.48 8.44 5.53 -1.15 ployment byy Sector Emp Secttor Employm ment Percen ntage May 201 14 changge vs. 4 Mining REPORT Man nufacturing Electricity, gas and water sup pply Construction Who olesale and rretail trade Tran nsport, storage and comm munication Financial intermediation, inssurance, etc. Com mmunity, soccial and perso onal servicess * An nnualized (000s)) 2 217 1,2 247 109 4 470 1,7 721 5 533 1,6 625 2,7 783 Apr 20 014* -1 10.96 -2.88 1 11.11 -2.55 -0.70 -1 11.15 -3.68 1.73 ployment byy Occupation n Emp Employmeent Percentage May 2014 changee vs. Apr 20 014* (000s) Legislators, senio or officials and managerss 1,1 134 8.53 Proffessionals 8 801 13.64 Tech hnical and asssociate proffessionals 1,6 629 -2.21 Clerks 1,4 492 -1.61 Servvice workers and shop an nd market saales workers 1,8 840 -0.65 Skilled agriculturral and fishery workers 92 13.19 Crafft and related d trades worrkers 1,3 315 -6.35 Plan nt and machine operators and assemblers 9 945 -15.05 Elem mentary occu upation 2,2 279 -2.63 Dom mestic workeers 8 801 -3.00 * An nnualized Occu upation Disclaimer n, analysis, opinions o and d materials presented in i this report are proviided to you for informaation The information purp poses only. TThis report may m not be reproduced in whole or in part witho out attributin ng the source to Adcorp.. The information and d opinions expressed e in this report have been compiled fro om sources believed to be reliable,, but neither Adcorp, nor any of its i directors,, officers, contractors or employees accepts liability for any loss arising from f the use hereof or makes any represeentation as to its accurracy and co ompleteness.. Informatio on, opinions and estim mates contained in this report refleect a judgmeent at its origginal date of publication n and are su ubject to chaange. Adco orp is not aggreeing to nor required to update research com mmentary an nd data. Therefore, inforrmation mayy not refleect events occcurring afteer the date of publication n. Adcorp maay issue otheer reports th hat are inconsistent with,, and reacch different conclusionss from, the information n presented in this repo ort. Those reports r refleect the diffeerent assu umptions, vieews and anaalytical methods of the analysts a who o prepared th hem. Adcorp p shall not bee responsible for any inaccurate in nformation and a shall nott be held ressponsible forr decisions made m as a ressult thereof. Adcorp doess not makke any repreesentations to t any party, and we shall have no liability inclu uding claimss for damagees of any naature whaatsoever. Ad dcorp, its subsidiary and associated companies and entities and their t emplo oyees, direcctors, 5 conttractors and agents shall not be responsible for any claims arising out of or in conn nection with the informaation conttained in this s publication n. REPORT 6


