Chapter 2 Thinking Like an Economist
advertisement
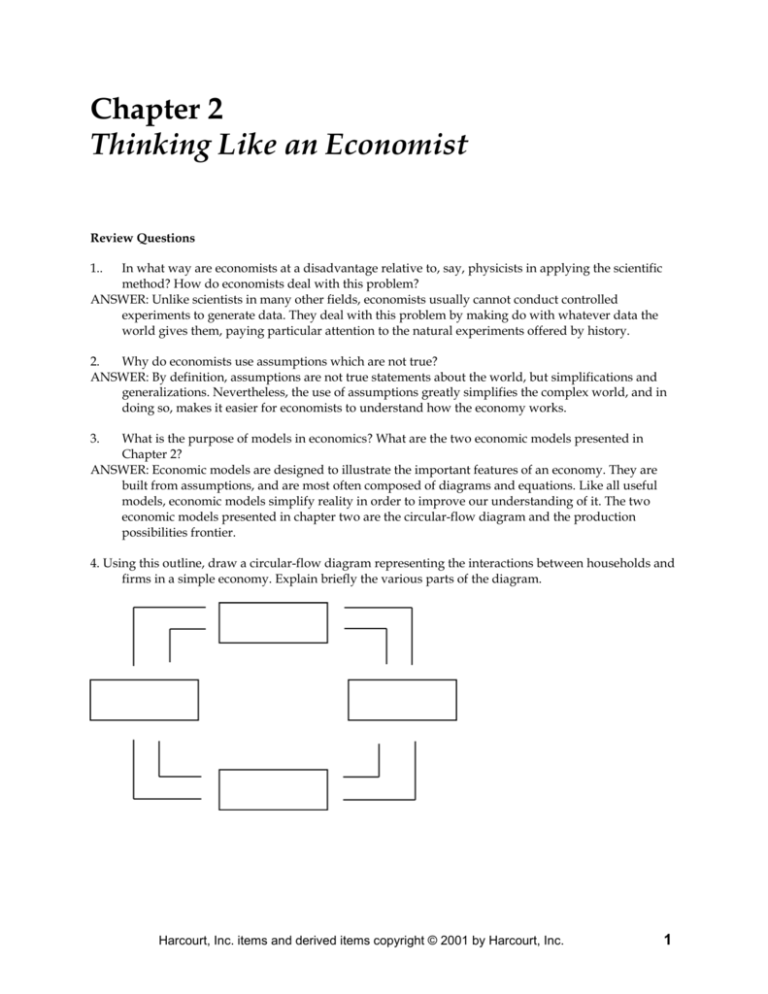
Chapter 2 Thinking Like an Economist Review Questions 1.. In what way are economists at a disadvantage relative to, say, physicists in applying the scientific method? How do economists deal with this problem? ANSWER: Unlike scientists in many other fields, economists usually cannot conduct controlled experiments to generate data. They deal with this problem by making do with whatever data the world gives them, paying particular attention to the natural experiments offered by history. 2. Why do economists use assumptions which are not true? ANSWER: By definition, assumptions are not true statements about the world, but simplifications and generalizations. Nevertheless, the use of assumptions greatly simplifies the complex world, and in doing so, makes it easier for economists to understand how the economy works. 3. What is the purpose of models in economics? What are the two economic models presented in Chapter 2? ANSWER: Economic models are designed to illustrate the important features of an economy. They are built from assumptions, and are most often composed of diagrams and equations. Like all useful models, economic models simplify reality in order to improve our understanding of it. The two economic models presented in chapter two are the circular-flow diagram and the production possibilities frontier. 4. Using this outline, draw a circular-flow diagram representing the interactions between households and firms in a simple economy. Explain briefly the various parts of the diagram. Harcourt, Inc. items and derived items copyright © 2001 by Harcourt, Inc. 1 2 Chapter 2/Thinking Like an Economist ANSWER: This diagram should duplicate the essential characteristics of the diagram in the text, with an explanation of the meaning of each flow and each market. It is important that the student understands that the inner loop represents the flow of real goods and services and that the outer loop represents the corresponding flow of payments. 5. Draw a production possibilities frontier for the production of hamburgers and pizzas. On the graph, identify the area of feasible outcomes and the area of infeasible outcomes. Now find an efficient point “A” and an inefficient point “B.” ANSWER: This graph should duplicate the essential features of the graph in the text. The production possibilities frontier should be bowed-outward. The feasible area is the frontier and the area inside Harcourt, Inc. items and derived items copyright © 2001 by Harcourt, Inc. Chapter 2/Thinking Like an Economist 3 the frontier, while the infeasible area is the area outside the frontier. Point “A” should be on the frontier, and point “B” should be inside the frontier. 6. Show how each of the following concepts can be illustrated using a production possibilities frontier: a. efficiency b. opportunity cost c. economic growth. ANSWER: a. Efficiency - any point on the production possibilities frontier b. c. 7. What changes must occur in an economy for its production possibilities frontier to shift outward? Is it possible for an economy’s production possibilities frontier to shift inward? Explain. ANSWER: For an economy’s production possibilities frontier to shift outward, available resources and/or technology must increase. This would be considered economic growth. It is possible for a Harcourt, Inc. items and derived items copyright © 2001 by Harcourt, Inc. 4 Chapter 2/Thinking Like an Economist production possibilities frontier to shift inward. For this to occur, there would have to be fewer available resources or a loss of technology. 8. For the production possibilities frontier illustrated in the graph shown: a. How would you measure the opportunity cost of obtaining more computers? b. How does that opportunity cost change as society chooses to produce and consume more computers? c. Why does the opportunity cost change that way? ANSWER: a. The opportunity cost of obtaining more computers is the number of snowboards that have to be given up to get more computers. b. As the production and consumption of computers increases, the opportunity cost of each new computer (the number of snowboards which must be given up) also increases. c. As the economy produces more and more computers, the resources best suited to making computers are used up, and resources better suited to producing snowboards must be used. When this happens, the production of snowboards is reduced a lot for each new computer produced. 9. Draw a production possibilities frontier representing the economy’s possible production of milk and eggs. Now, show what will happen to the frontier or the production point under each of the following circumstances. Use a separate graph to illustrate each situation. a. The outcome for the economy is efficient, with society choosing approximately equal amounts of milk and eggs. b. A recession causes a significant percentage of the labor force to become unemployed. c. Some cows are found to be infected with Mad Cow Disease, and many of the cows must be destroyed. d. Chickens are infected with a rare disease and egg-laying is reduced. e. Improvements in animal nutrition raise the general productivity of cows and chickens. f. The cow and chicken populations increase. g. The Surgeon General announces that drinking milk prolongs life. Harcourt, Inc. items and derived items copyright © 2001 by Harcourt, Inc. Chapter 2/Thinking Like an Economist ANSWER: Harcourt, Inc. items and derived items copyright © 2001 by Harcourt, Inc. 5 6 Chapter 2/Thinking Like an Economist 10. Identify each of the following topics as being part of microeconomics or macroeconomics: a. the impact of a change in consumer income on the purchase of luxury automobiles b. the effect of a change in the price of Coke on the purchase of Pepsi c. the impact of a war in the Middle East on the rate of inflation in the U.S. d. factors influencing the rate of economic growth e. factors influencing the demand for tractors f. the impact of tax policy on national saving g. the effect of pollution taxes on the U.S. copper industry h. the degree of competition in the cable television industry i. the effect of a balanced-budget amendment on economic stability j. the impact of deregulation on the savings and loan industry ANSWER: a, b, e, g, h, and j are microeconomic topics. c, d, f, and i are macroeconomic topics. 11. Which of the following statements are positive, and which are normative? a. The minimum wage creates unemployment among young and unskilled workers. b. The minimum wage ought to be abolished. c. If the price of a product in a market decreases, other things equal, quantity demanded will increase. d. A little bit of inflation is worse for society than a little bit of unemployment. e. There is a tradeoff between inflation and unemployment in the short run. f. If consumer income increases, other things equal, the demand for automobiles will increase. g. The U.S. income distribution is not equitable. h. U.S. workers deserve more liberal unemployment benefits. i. If interest rates increase, investment will decrease. j. If welfare benefits were reduced, the country would be better off. ANSWER: a, c, e, f, and i are positive statements. b, d, g, h, and j are normative statements. 12. While running for the presidency of the United States, Robert Kennedy made a famous statement: “Some men see the world the way it is and ask, ‘Why?’ I see the world the way it ought to be and ask, 'Why not?'" Explain how Kennedy’s statement identifies the distinction between normative and positive inquiry. ANSWER: To see the world the way it is and ask “Why?” is to conduct positive analysis. To see the world the way you think it ought to be is to make a normative judgment. The answer to the question, “Why not?” requires additional positive analysis. 13. Economists are involved in several areas of the Federal government. List two government departments, divisions, or branches which use economists and explain what duties these economists are assigned. ANSWER: Examples of departments, divisions, and branches of government which use economists include: President of the United States, Congress, Department of Treasury, Department of Labor, Department of Justice, Department of Commerce, Department of the Interior, Department of Agriculture, etc. Economists advise the president, write the annual Economic Report of the President, design tax policy, analyze data on workers and those looking for work, enforce the nation's antitrust laws, analyze economic developments in the U.S. and the world, etc. 14. Economists are often viewed as giving conflicting policy advice. However, in many cases, economists do offer a united view. Give three topics on which most economists agree. ANSWER: (Possible responses) 1. A ceiling on rents reduces the quantity and quality of housing available. 2. Tariffs and quotas usually reduce general economic welfare. 3. Flexible and floating exchange rates offer an effective international monetary arrangement. 4. Fiscal policy has a significant stimulative impact on a less than fully employed economy. Harcourt, Inc. items and derived items copyright © 2001 by Harcourt, Inc. Chapter 2/Thinking Like an Economist 7 5. If the federal budget is to be balanced, it should be done over the business cycle rather than yearly. 6. Cash payments increase the welfare of recipients to a greater degree than do transfers-in-kind of equal cash value. 7. A large federal budget deficit has an adverse effect on the economy. 8. A minimum wage increases unemployment among young and unskilled workers. 9. The government should restructure the welfare system along the lines of a negative income tax. 10. Effluent taxes and marketable pollution permits represent a better approach to pollution control than imposition of pollution ceilings. 15. John Maynard Keynes has suggested that the study of economics is not very difficult, yet few excel at it. A survey of the population might lead you to the same conclusion. In your opinion, why are so few students really good at economics? ANSWER: Keynes suggested that the key to the answer lies in the combination of talents that an individual must possess in order to be a good economist: mathematics, history, statesmanship, philosophy, etc. Mankiw suggests that the key to being a successful student of economics is in learning to think like an economist. 16. Why do economists use graphs? ANSWER: Graphs serve two purposes. You’ve heard the old saying, “A picture is worth a thousand words.” Graphs offer a way to express ideas visually that might be less clear if described with equations or words. Also, graphs provide a way of finding how variables are in fact related in the world. Graphs provide one way of expressing the relationship among variables. 17. What is the difference between a movement along a curve and a shift of a curve? What is the simplest way to tell when it is necessary to shift a curve? ANSWER: When there is a change from one point to another point on the same curve, that is a movement along the curve. This was caused by a change in a variable represented on either the x-axis or the yaxis. A shift of a curve occurs when the entire curve moves (either to the right or to the left for a demand curve). This would have occurred because a variable which affects the curve but is not represented on either the x-axis or y-axis has changed. The simplest way to tell is to look at the variables represented on the x-axis and y-axis. 1. Use the following demand curve to answer the following questions. Harcourt, Inc. items and derived items copyright © 2001 by Harcourt, Inc. 8 Chapter 2/Thinking Like an Economist a. How would point A be represented as an ordered pair? b. What type of curve is this? c. Does this curve show a positive or negative correlation between price and quantity? d. Compute the slope of the curve between points A and B. ANSWER: a. (15,8) b. a demand curve c. a negative correlation between price and quantity d. –4/20 = –1/5 19. Give two problems that economists should consider when dealing with graphs. ANSWER: 1. Omitted Variables - It is difficult to hold everything else constant when measuring how one variable affects another. It is possible that a person seeing the graph might decide that one variable on the graph is causing changes in the other variable when actually those changes are caused by a third variable not pictured on the graph. This could lead to a wrong conclusion. 20. Reverse Causality - This occurs when a person decides that event A causes event B to occur when in fact event B causes event A to occur. An example given in the text is the correlation between police and crime. Harcourt, Inc. items and derived items copyright © 2001 by Harcourt, Inc.
