VoltageCurrentResistance Lab
advertisement
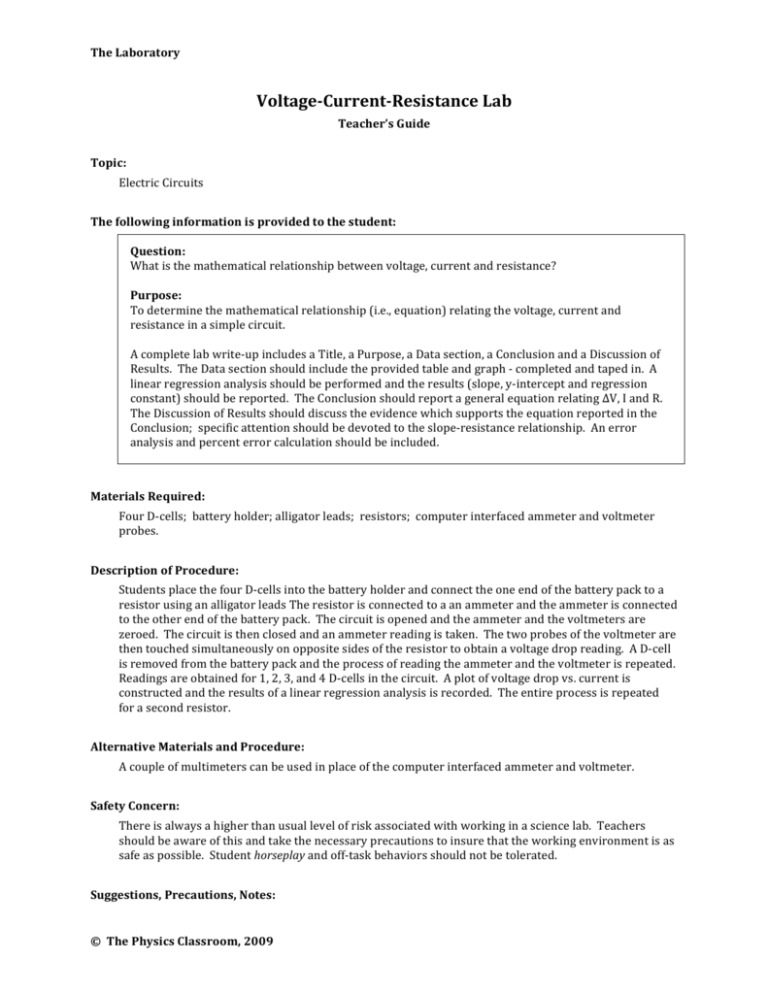
The Laboratory Voltage­Current­Resistance Lab Teacher’s Guide Topic: Electric Circuits The following information is provided to the student: Question: What is the mathematical relationship between voltage, current and resistance? Purpose: To determine the mathematical relationship (i.e., equation) relating the voltage, current and resistance in a simple circuit. A complete lab write‐up includes a Title, a Purpose, a Data section, a Conclusion and a Discussion of Results. The Data section should include the provided table and graph ‐ completed and taped in. A linear regression analysis should be performed and the results (slope, y‐intercept and regression constant) should be reported. The Conclusion should report a general equation relating ∆V, I and R. The Discussion of Results should discuss the evidence which supports the equation reported in the Conclusion; specific attention should be devoted to the slope‐resistance relationship. An error analysis and percent error calculation should be included. Materials Required: Four D‐cells; battery holder; alligator leads; resistors; computer interfaced ammeter and voltmeter probes. Description of Procedure: Students place the four D‐cells into the battery holder and connect the one end of the battery pack to a resistor using an alligator leads The resistor is connected to a an ammeter and the ammeter is connected to the other end of the battery pack. The circuit is opened and the ammeter and the voltmeters are zeroed. The circuit is then closed and an ammeter reading is taken. The two probes of the voltmeter are then touched simultaneously on opposite sides of the resistor to obtain a voltage drop reading. A D‐cell is removed from the battery pack and the process of reading the ammeter and the voltmeter is repeated. Readings are obtained for 1, 2, 3, and 4 D‐cells in the circuit. A plot of voltage drop vs. current is constructed and the results of a linear regression analysis is recorded. The entire process is repeated for a second resistor. Alternative Materials and Procedure: A couple of multimeters can be used in place of the computer interfaced ammeter and voltmeter. Safety Concern: There is always a higher than usual level of risk associated with working in a science lab. Teachers should be aware of this and take the necessary precautions to insure that the working environment is as safe as possible. Student horseplay and off‐task behaviors should not be tolerated. Suggestions, Precautions, Notes: © The Physics Classroom, 2009 The Laboratory 1. Consider conducting the procedure for Resistor #1 as a demonstration of how to use the measuring tools. Then have students conduct their own measurements for a second resistor. Consider pooling data from the entire class on the board. Make two columns ‐ resistance value and slope value ‐ and have students record the results of their study. Emphasize that the process of pooling class data is representative of the manner in which scientists work ‐ cooperatively and not competitively; openly and not secretively. And emphasize that when students pool class data it allows them to more easily identify patterns. Many students may have learned how to use a Graphing Calculator to plot a data set and to perform linear regression analysis on the set. Take advantage of the good work of our colleagues in the Math department and allow students to complete the data analysis on their calculators. Many resistors utilize a color code to convey the theoretical resistance. Information about the interpretation of the colors is typically available online. Conducting a Google search for "Resistor Color Code Convention" will return a collection of web sites, such as 2. 3. 4. http://www.diyaudioandvideo.com/Electronics/Color/ Auxiliary Materials: The following page is provided to the student for completion and inclusion in the Data section of their lab notebook. Resistor #1: R = Ω (based on color code) # of Cells ∆V (Volts) I (Amps) 1 2 3 4 Ω (based on color code) Resistor #2: R = # of Cells ∆V (Volts) I (Amps) 1 2 3 4 Scoring Rubric: C4. Voltage­Current­Resistance Lab Included, labeled and organized all parts of the lab report. Data section includes the provided table ‐ complete and taped in. Graph is sketched; sketch is clear. Results of linear regression analysis are recorded. © The Physics Classroom, 2009 Score _____/_____ The Laboratory Data is accurate; correlation constant if close to 1.00. Conclusion reports an equation relating ∆V, I and R. The equation is correct. Discussion of Results discusses the evidence which supports the equation, explaining how the data and graph lead logically to the equation; attention is given to how and why the slope and the resistance values are related. An error analysis is conducted; a percent error calculation is included; work is shown clearly and labeled. Connections to The Physics Classroom Tutorial: The following readings are a suitable accompaniment to this lab: http://www.physicsclassroom.com/Class/circuits/u9l3b.cfm http://www.physicsclassroom.com/Class/circuits/u9l3c.cfm Connections to Minds on Physics Internet Modules: Sublevels 4 and 5 of the Electric Circuits module are suitable accompaniments to this lab: http://www.physicsclassroom.com/mop/module.cfm © The Physics Classroom, 2009
