1. If Carol's disposable income increases from $1,200 to $1,700 and
advertisement
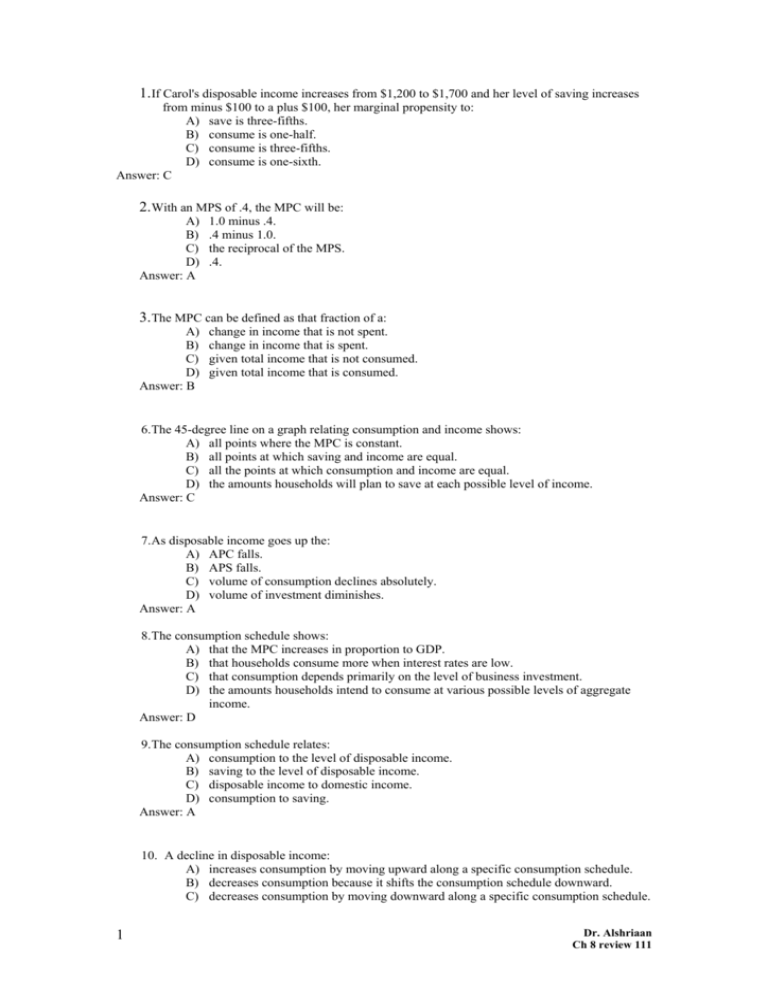
1.If Carol's disposable income increases from $1,200 to $1,700 and her level of saving increases from minus $100 to a plus $100, her marginal propensity to: A) save is three-fifths. B) consume is one-half. C) consume is three-fifths. D) consume is one-sixth. Answer: C 2.With an MPS of .4, the MPC will be: A) B) C) D) Answer: A 1.0 minus .4. .4 minus 1.0. the reciprocal of the MPS. .4. 3.The MPC can be defined as that fraction of a: A) B) C) D) Answer: B change in income that is not spent. change in income that is spent. given total income that is not consumed. given total income that is consumed. 6. The 45-degree line on a graph relating consumption and income shows: A) all points where the MPC is constant. B) all points at which saving and income are equal. C) all the points at which consumption and income are equal. D) the amounts households will plan to save at each possible level of income. Answer: C 7. As disposable income goes up the: A) APC falls. B) APS falls. C) volume of consumption declines absolutely. D) volume of investment diminishes. Answer: A 8. The consumption schedule shows: A) that the MPC increases in proportion to GDP. B) that households consume more when interest rates are low. C) that consumption depends primarily on the level of business investment. D) the amounts households intend to consume at various possible levels of aggregate income. Answer: D 9. The consumption schedule relates: A) consumption to the level of disposable income. B) saving to the level of disposable income. C) disposable income to domestic income. D) consumption to saving. Answer: A 10. A decline in disposable income: A) increases consumption by moving upward along a specific consumption schedule. B) decreases consumption because it shifts the consumption schedule downward. C) decreases consumption by moving downward along a specific consumption schedule. 1 Dr. Alshriaan Ch 8 review 111 D) increases consumption because it shifts the consumption schedule upward. Answer: C 11. The APC is calculated as: A) change in consumption / change in income. B) consumption / income. C) change in income / change in consumption. D) income / consumption. Answer: B 12. The consumption schedule shows: A) a direct relationship between aggregate consumption and accumulated wealth. B) a direct relationship between aggregate consumption and aggregate income. C) an inverse relationship between aggregate consumption and accumulated financial wealth. D) an inverse relationship between aggregate consumption and aggregate income. Answer: B 13. The APC can be defined as the fraction of a: A) change in income that is not spent. B) change in income that is spent. C) specific level of total income that is not consumed. D) specific level of total income that is consumed. Answer: D 14. The consumption schedule in the above diagram indicates that: a. consumers will maximize their satisfaction where the consumption schedule and 45° line intersect. b. up to a point consumption exceeds income, but then falls below income. c. the MPC falls as income increases. d. households consume as much as they earn. Answer: B 16. Which of the following is correct? e. APC + APS = 1. f. APC + MPS = 1. g. APS + MPC = 1. h. APS + MPS = 1. Answer: A 17. The consumption and saving schedules reveal that the: 2 Dr. Alshriaan Ch 8 review 111 a. MPC is greater than zero, but less than one. b. MPC and APC are equal at the point where the consumption schedule intersects the 45-degree line. c. APS is positive at all income levels. d. MPC is equal to or greater than one at all income levels. Answer: A 18. The size of the MPC is assumed to be: a. less than zero. b. greater than one. c. greater than zero, but less than one. d. two or more. Answer: C 19. As disposable income increases, consumption: a. and saving both increase. b. and saving both decrease. c. decreases and saving increases. d. increases and saving decreases. Answer: A 20. The relationship between consumption and disposable income is such that: a. an inverse and stable relationship exists between consumption and income. b. a direct, but very volatile, relationship exists between consumption and income. c. a direct and relatively stable relationship exists between consumption and income. d. the two are always equal. Answer: C 21. If the MPC is .8 and disposable income is $200, then: a. consumption and saving cannot be determined from the information given. b. saving will be $20. c. personal consumption expenditures will be $80. d. saving will be $40. Answer: A 22. The MPC for an economy is: a. the slope of the consumption schedule or line. b. the slope of the savings schedule or line. c. 1 divided by the slope of the consumption schedule or line. d. 1 divided by the slope of the savings schedule or line. Answer: A 23. Suppose a family's consumption exceeds its disposable income. This means that its: a. MPC is greater than 1. b. MPS is negative. c. APC is greater than 1. d. APS is positive. Answer: C 24. Dissaving means: a. the same thing as disinvesting. b. that households are spending more than their current incomes. 3 Dr. Alshriaan Ch 8 review 111 c. that saving and investment are equal. d. that disposable income is less than zero. Answer: B 25. Dissaving occurs where: a. income exceeds consumption. b. saving exceeds consumption. c. consumption exceeds income. d. saving exceeds income. Answer: C 26. Which of the following relations is not correct? a. 1 - MPC = MPS b. APS + APC = 1 c. MPS = MPC + 1 d. MPC + MPS = 1 Answer: C 27. At the point where the consumption schedule intersects the 45-degree line: a. the MPC equals 1. b. the APC is zero. c. saving equals income. d. saving is zero. Answer: D 28. The saving schedule is such that as aggregate income increases by a certain amount saving: a. increases by the same amount as the increase in income. b. does not change. c. increases, but by a smaller amount. d. increases by an even larger amount. Answer: C 29. If the marginal propensity to consume is .9, then the marginal propensity to save must be: a. 1. b. .1. c. 1.1. d. .9. Answer: B Use the following to answer questions 30-32: 30. Refer to the above data. The marginal propensity to consume is: a. .25. b. .75. c. .20. d. .80. 4 Dr. Alshriaan Ch 8 review 111 Answer: D 31. Refer to the above data. At the $200 level of disposable income: a. the marginal propensity to save is 2½ percent. b. dissaving is $5. c. the average propensity to save is .20. d. the average propensity to consume is .80. Answer: B 32. Refer to the above data. If disposable income was $325, we would expect consumption to be: a. $315. b. $305. c. $20. d. $290. Answer: B Use the following to answer questions 33-38: 33. 34. Refer to the above diagram. The average propensity to consume is 1 at point: a. F. b. A. c. D. d. B. Answer: B 35. Refer to the above diagram. The marginal propensity to consume is equal to: a. AE/0E. b. CF/CD. c. CB/AB. d. CD/CF. Answer: C 36. Refer to the above diagram. At income level F the volume of saving is: a. BD. b. AB. c. CF-BF. d. CD. 5 Dr. Alshriaan Ch 8 review 111 Answer: D 37. Refer to the above diagram. Consumption will be equal to income at: a. an income of E. b. an income of F. c. point C. d. point D. Answer: A 38. Refer to the above diagram. The economy is dissaving: a. in the amount CD. b. at all income levels greater than E. c. at income level H. d. at income level E. Answer: C 39. Use the following to answer questions 39-40: 40. The above figure suggests that: a. consumption would be $60 billion even if income were zero. b. saving is zero at the $120 billion income level. c. as income increases, consumption decreases as a percentage of income. d. as income increases, consumption decreases absolutely. Answer: C 41. Refer to the above figure. If the relevant saving schedule were constructed: a. saving would be minus $20 billion at the zero level of income. b. aggregate saving would be $60 at the $60 billion level of income. c. its slope would be 1/2. d. it would slope downward and to the right Answer: A Answer the next question(s) on the basis of the following data for a hypothetical economy. 6 Dr. Alshriaan Ch 8 review 111 42. Refer to the above data. The marginal propensity to consume is: a. .80. b. .75. c. .20. d. .25. Answer: A 43. Refer to the above data. At the $100 level of income, the average propensity to save is: a. .10. b. .20. c. .25. d. .90. Answer: A 44. Refer to the above data. If plotted on a graph, the slope of the saving schedule would be: a. .80. b. .10. c. .20. d. .15. Answer: C Use the following to answer questions 45-47: 45. Refer to the above diagram. The marginal propensity to save is equal to: a. CD/0D. b. 0B/0A. c. 0D/0D. d. CD/BD. Answer: D 46. Refer to the above diagram. At disposable income level D, the average propensity to save is equal to: a. CD/BD. b. CD/0D. 7 Dr. Alshriaan Ch 8 review 111 c. 0D/CD. d. 0A/0B. Answer: B 47. Refer to the above diagram. At disposable income level D, consumption is: a. equal to CD. b. equal to D minus CD. c. equal to CD/D. d. equal to CD plus BD. Answer: B Use the following to answer questions: Answer the next question(s) on the basis of the following consumption schedules. DI signifies disposable income and C represents consumption expenditures. All figures are in billions of dollars. 48. Refer to the above data. The marginal propensity to consume in economy (1) is: a. .5. b. .3. c. .8. d. .7. Answer: D 49. Refer to the above data. The marginal propensity to consume: a. is highest in economy (1). b. is highest in economy (2). c. is highest in economy (3). d. cannot be calculated from the data given. Answer: C 50. Refer to the above data. The marginal propensity to save: a. is highest in economy (1). b. is highest in economy (2). c. is highest in economy (3). d. cannot be determined from the data given. Answer: A 51. Refer to the above data. At an income level of $40 billion, the average propensity to consume: a. is highest in economy (1). b. is highest in economy (2). c. is highest in economy (3). 8 Dr. Alshriaan Ch 8 review 111 d. cannot be determined from the data given. Answer: B 52. Refer to the above data. At an income level of $400 billion, the average propensity to save in economy (2) is: a. .9125. b. .0725. c. .0875. d. .9305. Answer: C 53. (Advanced analysis) Refer to the above data. When plotted on a graph, the vertical intercept of the consumption schedule in economy (3) is _____ and the slope is _____. a. minus $2; .9. b. $2; .18. c. $100; .5. d. $2; .9. Answer: D 54. Refer to the above data. Suppose that consumption decreased by $2 billion at each level of DI in each of the three countries. We can conclude that the: a. marginal propensity to consume will remain unchanged in each of the three countries. b. marginal propensity to consume will decline in each of the three countries. c. average propensity to save will fall at each level of DI in each of the three countries. d. marginal propensity to save will rise in each of the three countries. Answer: A 55. Refer to the above data. A $2 billion increase in consumption at each level of DI could be caused by: a. a decrease in consumer wealth. b. new expectations of higher future income. c. an increase in taxation. d. an increase in saving. Answer: B 56. The investment demand curve will shift to the right as a result of: a. an increase in the excess production capacity available in industry. b. an increase in business taxes. c. technological progress. d. an increase in the acquisition and maintenance cost of capital goods. Answer: C 57. The investment demand curve will shift to the left as a result of: a. an increase in the excess production capacity available in industry. b. a decrease in business taxes. c. increased business optimism with respect to future economic conditions. d. a decrease in labor costs. Answer: A 9 Dr. Alshriaan Ch 8 review 111 58. If the real interest rate in the economy is i and the expected rate of return from additional investment is r, then more investment will be forthcoming when: a. r falls. b. i is greater than r. c. r is greater than i. d. i rises. Answer: C 59. A rightward shift of the investment demand curve might be caused by: a. an increase in the price level. b. a decline in the real interest rate. c. an increase in the expected rate of return on investment. d. an increase in business taxes. Answer: C 60. The real interest rate is: a. the percentage increase in money that the lender receives on a loan. b. the percentage increase in purchasing power that the lender receives on a loan. c. also called the after-tax interest rate. d. usually higher than the nominal interest rate. Answer: B 61. When we draw an investment demand curve we hold constant all of the following except: a. the expected rate of return on the investment. b. business taxes. c. the interest rate. d. the present stock of capital goods. Answer: C 62. If the nominal interest rate is 18 percent and the real interest rate is 6 percent, the inflation rate is: a. 18 percent. b. 24 percent. c. 12 percent. d. 6 percent. Answer: C 63. If the inflation rate is 10 percent and the real interest rate is 12 percent, the nominal interest rate is: a. 2 percent. b. zero percent. c. 10 percent. d. 22 percent. Answer: D 64. A high rate of inflation is likely to cause a: a. high nominal interest rate. b. low nominal interest rate. c. low rate of growth of nominal GDP. d. decrease in nominal wages. Answer: A 10 Dr. Alshriaan Ch 8 review 111 65. If the real interest rate in the economy is i and the expected rate of return on additional investment is r, then other things equal: a. more investment will be forthcoming when i exceeds r. b. less investment will be forthcoming when r rises. c. r will fall as more investment is undertaken. d. r will exceed i at all possible levels of investment. Answer: C 66. If the real interest rate in the economy is i and the expected rate of return on additional investment is r, then other things equal: a. investment will take place until i and r are equal. b. investment will take place until r exceeds i by the greatest amount. c. r will rise as more investment is undertaken. d. i will fall as more investment is undertaken. Answer: A 67. The multiplier effect means that: a. consumption is typically several times as large as saving. b. a change in consumption can cause a larger increase in investment. c. an increase in investment can cause GDP to change by a larger amount. d. a decline in the MPC can cause GDP to rise by several times that amount. Answer: C 68. The multiplier is: a. 1/MPC. b. 1/(1 + MPC). c. 1/MPS. d. 1/(1 - MPS). Answer: C 69. The multiplier is useful in determining the: a. full-employment unemployment rate. b. level of business inventories. c. rate of inflation. d. change in GDP resulting from a change in spending. Answer: D 70. The multiplier is defined as: a. 1 - MPS. b. change in GDP × initial change in spending. c. change in GDP/initial change in spending. d. change in GDP - initial change in spending. Answer: C 71. If 100 percent of any change in income is spent, the multiplier will be: a. equal to the MPC. b. 1. c. zero. d. infinitely large. Answer: D 11 Dr. Alshriaan Ch 8 review 111 72. The multiplier can be calculated as: a. 1/(MPS + MPC). b. MPC/MPS. c. 1/(1 - MPC). d. 1 - MPC = MPS. Answer: C 73. The multiplier: a. occurs only in response to a change in the level of investment spending. b. can be found by taking the reciprocal of the MPS. c. occurs only when intended investment increases as GDP increases. d. is measured by the slope of the saving schedule. Answer: B 74. The size of the multiplier is equal to the: a. slope of the consumption schedule. b. reciprocal of the slope of the consumption schedule. c. slope of the saving schedule. d. reciprocal of the slope of the saving schedule. Answer: D 75. If the MPS is only half as large as the MPC, the multiplier is: a. 2. b. 3. c. 4. d. 5. Answer: B 76. If the MPC is .70 and gross investment increases by $3 billion, the equilibrium GDP will: a. increase by $10 billion. b. increase by $2.10 billion. c. decrease by $4.29 billion. d. increase by $4.29 billion. Answer: A 77. The numerical value of the multiplier will be smaller the: a. larger the average propensity to consume. b. larger the slope of the saving schedule. c. larger the slope of the consumption schedule. d. smaller the slope of the saving schedule. Answer: B 78. The practical significance of the multiplier is that it: a. equates the real interest rate and the expected rate of return on investment. b. magnifies initial changes in spending into larger changes in GDP. c. keeps inflation within tolerable limits. d. helps to stabilize the economy. Answer: B 12 Dr. Alshriaan Ch 8 review 111 79. The multiplier: a. varies directly with the slope of the investment demand schedule. b. is unrelated to the slope of the saving schedule. c. will be greater, the smaller is the slope of the saving schedule. d. will be greater, the steeper is the slope of the saving schedule. Answer: C 80. The increase in income that results from an increase in investment spending would be greater the: a. smaller the MPS. b. smaller the APC. c. larger the MPS. d. smaller the MPC. Answer: A 81. The multiplier effect: a. reduces the MPC. b. magnifies changes in spending into larger changes in output and income. c. promotes stability of the general price level. d. lessens upswings and downswings in business activity. Answer: B 82. If the MPC is .6, the multiplier will be: a. 4.0. b. 6.0. c. 2.5. d. 1.67. Answer: C 83. Assume the MPC is 2/3. If investment spending increases by $2 billion, the level of GDP will increase by: a. $3 billion. b. $2/3 billion. c. $6 billion. d. $2 billion. Answer: C 84. The multiplier is: a. 1/APS. b. 1/APC. c. 1/MPC. d. 1/MPS. Answer: D 85. The multiplier applies to: a. investment but not to net exports or government spending. b. investment, net exports, and government spending. c. increases in spending but not to decreases in spending. d. spending by the private sector but not by the public sector. 86. Answer: B 13 Dr. Alshriaan Ch 8 review 111 87. The multiplier effect indicates that: a. a decline in the interest rate will cause a proportionately larger increase in investment. b. a change in spending will change aggregate income by a larger amount. c. a change in spending will increase aggregate income by the same amount. d. an increase in total income will generate a larger change in aggregate expenditures. Answer: B Answer the next question(s) on the basis of the following table that illustrates the multiplier process. 88. Refer to the above table. The marginal propensity to consume is: a. .5. b. .75. c. .8. d. .9. Answer: C 89. Refer to the above table. The marginal propensity to save is: a. .5. b. .25. c. .2. d. .1. Answer: C 90. Refer to the above table. The change in income in round two will be: a. $4. b. $16. c. $20. d. $24. Answer: B 91. Refer to the above table. The total change in income resulting from the initial change in investment will be: a. $100. b. $20. c. $80. d. $200. Answer: A 92. Refer to the above table. The total change in consumption resulting from the initial change in investment will be: 14 Dr. Alshriaan Ch 8 review 111 a. b. c. $100. $96. $180. d. $80. Answer: D 93. Refer to the above table. The multiplier in this economy is: a. 2. b. 4. c. 5. d. 10. Answer: C 15 Dr. Alshriaan Ch 8 review 111

