IN-HOME TV VIEWING RISES YOY; AUSSIE HOMES MORE CONNECTED THAN
EVER: Q3 2014 MULTI-SCREEN REPORT
Contact:
Margaret Fearn
Fearnace Media
T: + 1 508 369 7189
margaret@fearnacemedia.com
Jackie Helliker
Nielsen
T: + 61 (0) 403 074 864
jackie.helliker@nielsen.com
Friday, 19 December, 2014
The time Australians spent watching TV on conventional in-home TV sets rose more than
an hour per month year-on-year (YOY) in Q3 2014, even as household take-up of internetconnected devices reached a new high.
Those are among the findings in the latest Australian Multi-Screen Report, covering the
third quarter of calendar 2014.
The report also includes a special study on homes with internet-connected mobile devices:
their presence, the extent to which household members share these devices, and the
purposes for which they use them.
TV VIEWING AND TECHNOLOGY PENETRATION IN AUSTRALIAN HOMES
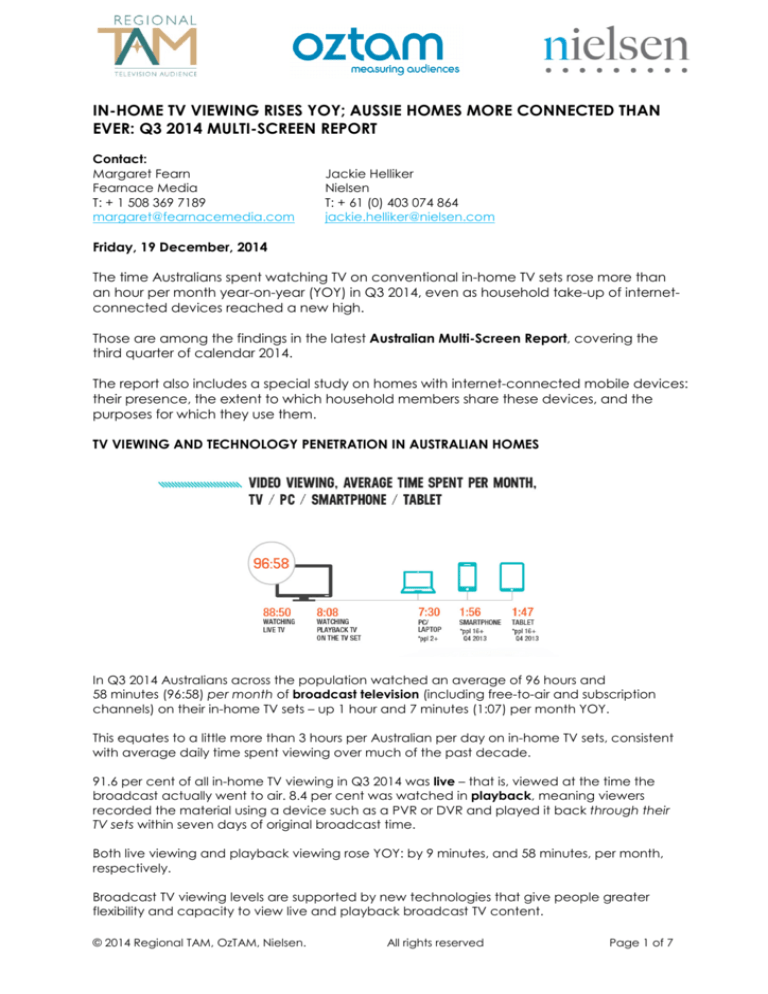
In Q3 2014 Australians across the population watched an average of 96 hours and
58 minutes (96:58) per month of broadcast television (including free-to-air and subscription
channels) on their in-home TV sets – up 1 hour and 7 minutes (1:07) per month YOY.
This equates to a little more than 3 hours per Australian per day on in-home TV sets, consistent
with average daily time spent viewing over much of the past decade.
91.6 per cent of all in-home TV viewing in Q3 2014 was live – that is, viewed at the time the
broadcast actually went to air. 8.4 per cent was watched in playback, meaning viewers
recorded the material using a device such as a PVR or DVR and played it back through their
TV sets within seven days of original broadcast time.
Both live viewing and playback viewing rose YOY: by 9 minutes, and 58 minutes, per month,
respectively.
Broadcast TV viewing levels are supported by new technologies that give people greater
flexibility and capacity to view live and playback broadcast TV content.
© 2014 Regional TAM, OzTAM, Nielsen.
All rights reserved
Page 1 of 7
For example:
•
•
55 per cent of homes have a recording device such as a PVR or DVR, and 15 per
cent have two or more.
Every Australian TV home can receive digital terrestrial television (DTT) broadcasts,
and 95 per cent can receive DTT channels on every working household TV set, greatly
expanding channel choice.
Household internet penetration has been steady for the past six quarters, at 80 per cent.
The progressive take-up of internet-capable devices – including televisions, tablets,
smartphones and in-home computers – is creating further opportunities to watch broadcast
TV and other video content.
Viewing on mobile devices however remains small compared to that on traditional television
sets, reflecting people’s preference to watch on the biggest available screen.
In Q3 2014 Australians aged 2+ spent an average 37 hours and 44 minutes (37:44) online
each month on home and work computers. They devoted 7:30 to watching any online video
© 2014 Regional TAM, OzTAM, Nielsen.
All rights reserved
Page 2 of 7
on PC or laptop computers (including broadcast TV content and other video), compared to
5:18 in Q3 2013.
45 per cent of homes have tablets, up from 42 per cent in Q2 2014 and 37 per cent a year
ago. Across the Australian online population aged 16+ people claim to spend 1:47 per
month watching any online video on a tablet (Q4 2013).
74 per cent of Australians aged 16+ own a smartphone, compared to 67 per cent in Q3 2013.
Across the Australian online population aged 16+ people report spending 1:56 per month
watching any online video on a smartphone (Q4 2013).
29 per cent of homes have internet-capable televisions (i.e., ‘hybrid’ or ‘smart’ TVs – whether
actually connected or not), compared to 22 per cent a year ago.
While the increase in average monthly time spent viewing broadcast television on in-home
TV sets in the quarter was mainly driven by children under 12 and people aged 50+, all age
groups continue to spend the majority of their viewing time watching broadcast TV content
on their in-home TV sets.
© 2014 Regional TAM, OzTAM, Nielsen.
All rights reserved
Page 3 of 7
SPECIAL STUDY – HOMES WITH INTERNET-CONNECTED MOBILE DEVICES
To understand how internet-connected mobile device users (tablet and smartphone
users in particular) use and share those devices with other household members, a
special study was conducted in September, 2014.
1,800 people aged 14+ living in households with access to one or more internetconnected mobile devices were asked:
•
•
•
•
•
what device(s) they have access to;
which device(s) they use;
what activities they use the device(s) for;
which device(s) they share with other household members; and,
whether they use the device(s) for viewing video – either alone or with others.
Study participants were nationally representative by state, age and gender.
Note: This study focused on users of internet-connected mobile devices, so all study
participants had access to one or more within their home. That is not the case across the
Australian population as a whole, so the findings should not be extrapolated to
represent all Australian homes.
Among the special study’s findings:
•
Smartphones are the most common internet-connected mobile devices in study
participants’ homes (91 per cent), followed by tablets (60 per cent), iPods (22 per
cent) and Kindles/e-readers (20 per cent).
•
Larger households, and those with kids and teens, are more likely to have a
greater number of internet-connected mobile devices.
•
Tablets are more likely to be shared than smartphones: across all study
participants, 54 per cent share their tablets vs 38 per cent for smartphones.
•
People in larger households are more likely to share tablets and smartphones with
other household members – particularly those homes with children under age 18.
•
Sharing tendencies also vary by age group and life stage. For example:
o
o
o
o
•
69 per cent of 25-34 year-olds, and 70 per cent of 35-44 year-olds, say
they share their tablets with someone else in the home, whereas only 35
per cent of people 55+ do.
People 35 and older are more likely to share their tablets with children
under age 14 than are people under age 35.
14-17s and 35-44s share their tablet with the greatest number of people in
the home (on average 1.6 and 1.5 people, respectively.)
14-17s and 18-24 year-olds share their smartphones with the greatest
number of household members (on average 1.6 and 1.5 people,
respectively).
The top activities among people aged 14+ are similar across tablets and
smartphones: email; accessing search engines; social networking; getting news
© 2014 Regional TAM, OzTAM, Nielsen.
All rights reserved
Page 4 of 7
and information; accessing maps or navigation information; and
video/entertainment.
•
Accessing TV networks’ catch-up TV websites and apps is more common on
tablets than on smartphones – both via websites and apps:
o
o
20 percent of tablet users aged 14+ claim to have visited a catch-up TV
website, and 15 percent to have used a catch-up TV app, on their tablets
over the course of a month.
8 per cent of smartphone users aged 14+ claim to have visited a catch-up
TV website, and 5 per cent to have used a catch-up TV app, using their
smartphones over the course of a month.
•
14-34 year-olds are the most frequent video viewers on both tablets and
smartphones, with people over age 35 significantly less likely to say they have
ever watched any video content on either device – particularly smartphones.
•
User-generated content is the most popular type of video people claim to view
on their internet-connected mobile devices, followed by comedy and
news/current affairs.
•
86 per cent of tablet users aged 14+ in study homes report ever using their tablets
to access the internet or apps while watching TV (simultaneously) in the past 12
months (77 per cent for smartphone users).
•
14-17 year-olds and 25-34 year-olds use their tablets and smartphones while
watching TV most frequently; people aged 55+ are the least likely to have ever
done so.
Conclusion
The findings of this special study of people living in mobile internet-connected device
households are consistent with research presented in earlier editions of the Australian
Multi-Screen Report.
While audiences increasingly watch video content on mobile screens, such viewing is
not the primary activity for which people use their internet-connected mobile devices.
Moreover younger people are more likely to view any video on tablets and smartphones
than are older age groups.
Deborah Wright, Regional TAM Chair, said: “Regional TAM households continue to deliver
strong ‘live’ viewing results in comparison to the national average. The Q3 Australian
Multi-Screen Report’s study on internet-connected mobile devices in the home showcases some interesting findings on how we use and share these devices in our homes.”
OzTAM CEO Doug Peiffer said: “For all the changes and new options viewers have,
television is still the centrepiece. Live TV viewing is level year-on-year, playback is up by
nearly an hour, and people are spending more time with their television sets overall,
because TVs are more versatile than ever. On top of their TV viewing time, Australians
increasingly use their televisions to play games, watch DVDs or internet-delivered video,
browse the internet, or playback TV content they’ve recorded beyond seven days from
original broadcast. Such activities underscore the strength of TV and reinforce its position
as the household main screen.”
© 2014 Regional TAM, OzTAM, Nielsen.
All rights reserved
Page 5 of 7
Nielsen’s Senior Vice President, Cross Platform Audience Measurement, Erica Boyd said:
“As people increase their overall time consuming content across screens, marketers
have more opportunities to seamlessly connect with people in a way that is respectful of
their time, relevant and interesting.”
SUMMARY OF KEY FINDINGS: Q3 (JULY – SEPTEMBER) 2014:
•
Australians watch on average 96 hours and 58 minutes (96:58) of broadcast TV on
traditional television sets per month1 - up 1:07 per month year-on-year (YOY).
•
91.6% of all broadcast TV viewing is live, with playback of broadcast content that
viewers record and play back through their TV sets within seven days accounting
for 8.4% (8:08 per month, up 58 minutes/month YOY).
•
100% of Australian television homes can access digital terrestrial television (DTT)
channels. 95% can do so on every working household TV set.
•
55% of homes have PVRs; 15% have two or more (Q3 2013: 53%; 14%).
•
Household internet penetration is stable at 80%.
•
Australians spend on average 37:44 per month online2.
•
29% of homes have internet-capable TVs, whether connected or not (Q3 2013: 22%).
•
45% of homes have tablets (37% in Q3 2013).
Across the online population aged 16+, people claim to spend an average 1:47
per month3 using tablets to watch any online video – which can include both
broadcast television and non-broadcast material.
•
74% of Australians aged 16+ own a smartphone (67% in Q3 2013) and self-report an
average 1:56 per month4 viewing any video on these devices.
•
13.377 million Australians watch some video on the Internet each month (including
broadcast TV and non-broadcast content): an average of 7:30 per month.
Such viewing is highest among people aged 18-24 (9:09/per month)5.
•
89.6% of all video viewing6 – across all screens, and including broadcast and nonbroadcast content – is on the traditional TV set7:
1 OzTAM and Regional TAM. All people figures. 2am-2am. Please note TV viewing is seasonal, rising in
winter and with the end of daylight saving, and dipping in summer months.
2 Nielsen Online Ratings. Ppl 2+.
3 Nielsen Australian Connected Consumers report 2014.
4 Nielsen Australian Connected Consumers report 2014.
5 Nielsen Online Ratings – Hybrid Streaming (formerly VideoCensus) ppl 2+. Please note March 2014
constituted a trend break for all key audience metrics from Nielsen Online Ratings – Hybrid, with the
removal of ‘inactive’ panellists.
6 Time spent viewing via the conventional TV includes broadcast content only; video viewing on PC,
tablets and smartphones (‘other devices’) can include both broadcast and non-broadcast content.
7 TV viewing: OzTAM/Regional TAM, all people, Q3 2014, 2am-2am. Other devices: Ppl 16+
smartphones/tablets, Q4 2013; Internet: Ppl 2+, Q3 2014, Nielsen Online Ratings.
© 2014 Regional TAM, OzTAM, Nielsen.
All rights reserved
Page 6 of 7
o
o
o
o
96:58 per month on the TV set (89.6%)
7:30 per month online via PCs/laptops (6.9%)
1:56 per month on smartphones (1.8%)
1:47 per month on tablets (1.6%)
Sources: Regional TAM, OzTAM, Nielsen.
Further detail is provided in the report, available upon request.
About The Australian Multi-Screen Report
The Australian Multi-Screen Report, released quarterly, is the first and only national research
into trends in video viewing in Australian homes across television, computers and mobile
devices. It combines data from the three best available research sources: the OzTAM and
Regional TAM television ratings panels and Nielsen’s national NetView panel, Consumer &
Media View database and Australian Connected Consumers report.
About Regional TAM
Regional TAM Pty Limited is a joint venture comprising the five free-to-air (FTA) regional
commercial networks – NBN Limited, Prime Television Pty Ltd, Seven Queensland, Southern
Cross Austereo, and WIN Corporation Pty Ltd. Collected and marketed by Nielsen Television
Audience Measurement, Regional TAM data is the official television audience measurement
(TAM) of FTA and Subscription Television viewing in the five east coast aggregated regional
markets, including its 19 component sub-markets, and the Regional Western Australian market.
Regional TAM television ratings information is designed to be an independent, reliable and
transparent audience measurement system that provides the currency by which television is
bought, sold and evaluated. The audience data is used by a range of parties such as
television networks, advertisers, media buyers and program suppliers to aid them to
understand viewer behaviour, and in assessing program or network performance. More at
http://www.regionaltam.com.au
About OzTAM
OzTAM is Australia’s official source of television audience measurement (TAM) covering the
five metropolitan markets (Sydney, Melbourne, Brisbane, Adelaide and Perth) and nationally
for subscription television. OzTAM ratings are the accepted metric by which Australian
television is evaluated. The media industry uses OzTAM data to assist in program development,
advertising planning and to gauge the performance of television programs, networks and
advertising campaigns. More at: www.oztam.com.au
About Nielsen
Nielsen Holdings N.V. (NYSE: NLSN) is a global information and measurement company with
leading market positions in marketing and consumer information, television and other media
measurement, online intelligence and mobile measurement. Nielsen has a presence in
approximately 100 countries, with headquarters in New York, USA and Diemen, the
Netherlands. For more information, visit www.nielsen.com
© 2014 Regional TAM, OzTAM, Nielsen.
All rights reserved
Page 7 of 7


