Standard Error and Confidence Intervals
advertisement
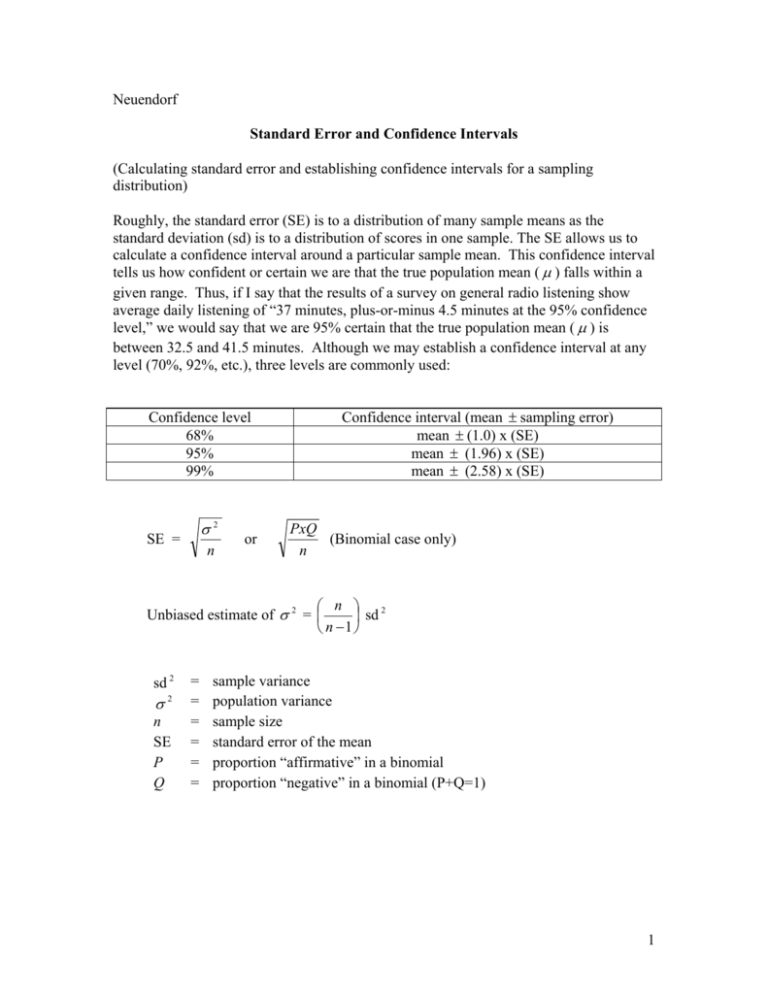
Neuendorf Standard Error and Confidence Intervals (Calculating standard error and establishing confidence intervals for a sampling distribution) Roughly, the standard error (SE) is to a distribution of many sample means as the standard deviation (sd) is to a distribution of scores in one sample. The SE allows us to calculate a confidence interval around a particular sample mean. This confidence interval tells us how confident or certain we are that the true population mean ( µ ) falls within a given range. Thus, if I say that the results of a survey on general radio listening show average daily listening of “37 minutes, plus-or-minus 4.5 minutes at the 95% confidence level,” we would say that we are 95% certain that the true population mean ( µ ) is between 32.5 and 41.5 minutes. Although we may establish a confidence interval at any level (70%, 92%, etc.), three levels are commonly used: Confidence level 68% 95% 99% σ2 SE = n or Confidence interval (mean ± sampling error) mean ± (1.0) x (SE) mean ± (1.96) x (SE) mean ± (2.58) x (SE) PxQ (Binomial case only) n ⎛ n ⎞ 2 Unbiased estimate of σ 2 = ⎜ ⎟ sd ⎝ n −1 ⎠ sd 2 σ 2 n SE P Q = = = = = = sample variance population variance sample size standard error of the mean proportion “affirmative” in a binomial proportion “negative” in a binomial (P+Q=1) 1 Confidence Interval Example: You have just completed a study of TV viewing in your community. The mean viewing time for TV watched yesterday in the random sample was 164 minutes. The sample sd was 85 minutes, and the sample size was 400. What is the standard error of the mean? What are the 68% and 95% confidence intervals? We know: mean = 164 min. sd = 85 min. n = 400 persons So: ⎛ n ⎞ 2 est. σ 2 = ⎜ ⎟ sd ⎝ n −1 ⎠ ⎛ 400 ⎞ 2 =⎜ ⎟ 85 ⎝ 399 ⎠ = (1.0025) x (7225) = 7243 SE = = σ2 n 7243 400 = 18.1 = 4.3 min. Thus, we are 68% confident that the true population mean is 164 ± (1.0) x (4.3) minutes, or between 159.7 and 168.3 minutes of TV viewing. And, we are 95% confident that the true population mean is 164 ± (1.96) x (4.3) minutes, or between 155.6 and 172.4 minutes of viewing. How about the 99% confidence interval? Sample size example: We can also use the formulae to calculate the sample size (n) we need, if we pick our acceptable standard error, or margin of error. Imagine that you’ve been hired to conduct a study to estimate the proportion of local citizens who own a VCR. What must your sample size be if you want an overall sampling error of ± 3% at the 95% confidence level? We know: Sampling error = .03 = (1.96) x (SE) at 95% CL Therefore, SE = .03 = .0153 1.96 2 Since this is the binomial case: SE = PxQ n NOTE: We will assume the most liberal case for PxQ, in order to assure a large enough sample size. PxQ will be greatest if there is a 50/50 split on the binomial variable (PxQ = (.5) x (.5) = .25). So: (.5) x(.5) n .0153 = .00023 = (.5) x(.5) n (.00023) x (n) = .25 n = .25 .00023 n = 1087 The needed sample size to ensure a 3% margin of error at the 95% confidence level is 1087 subjects! 1/07 3

