airmasses and Fronts
advertisement
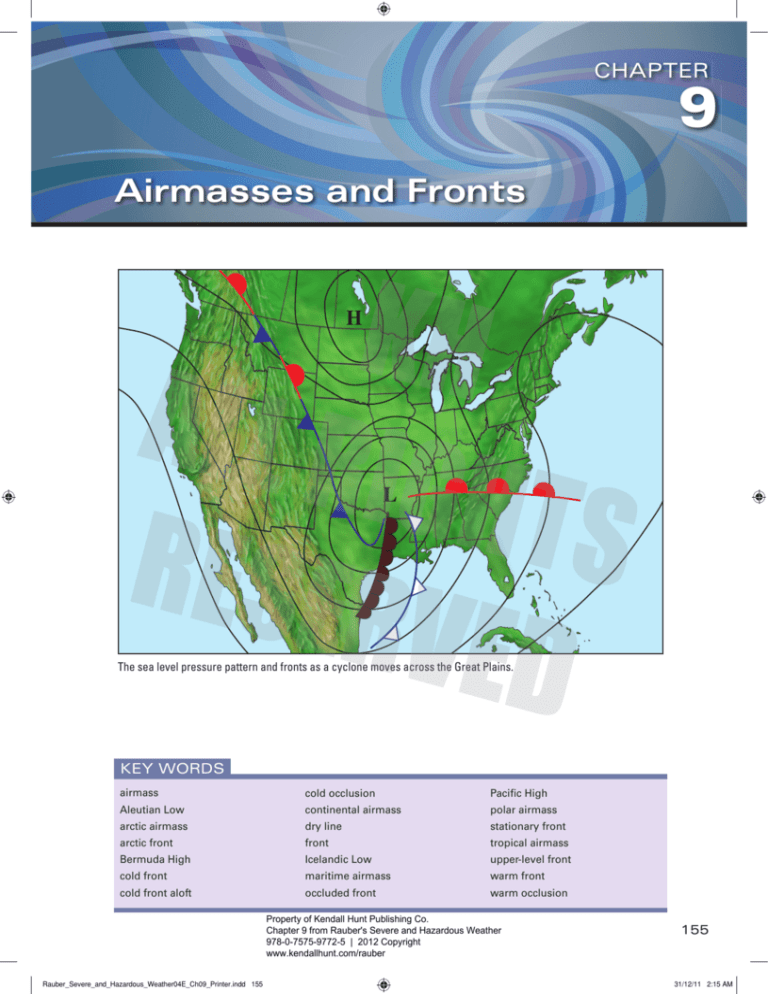
CHAPTER 9 airmasses and Fronts H L The sea level pressure pattern and fronts as a cyclone moves across the Great Plains. KEY WORDS airmass cold occlusion Pacific High Aleutian Low continental airmass polar airmass arctic airmass dry line stationary front arctic front front tropical airmass Bermuda High Icelandic Low upper-level front cold front maritime airmass warm front cold front aloft occluded front warm occlusion Property of Kendall Hunt Publishing Co. Chapter 9 from Rauber's Severe and Hazardous Weather 978-0-7575-9772-5 | 2012 Copyright www.kendallhunt.com/rauber Rauber_Severe_and_Hazardous_Weather04E_Ch09_Printer.indd 155 155 31/12/11 2:15 AM 156 Chapter 9 Airmasses and Fronts Lea r n i n g O b j e c t i v e s After studying this chapter, you should be able to: 1. identify the major airmass source regions in North America; 2. describe typical characteristics of airmasses, including depth and horizontal dimensions; 3. identify airmasses on a surface map based on temperature and moisture characteristics; 4. explain how temperature changes across a cold front, a warm front, a stationary front, a dry line, an occluded front, and an upper-level front; 5. identify fronts on surface maps based on the temperature, dewpoint temperature, wind, pressure, and precipitation patterns; 6. describe the types of precipitation that may occur in the vicinity of fronts. Airmasses A n airmass is a large body of air with relatively uniform thermal and moisture characteristics. Airmasses cover large regions of the earth, typically several hundred thousand square kilometers, and can be as deep as the depth of the troposphere or as shallow as 1 to 2 km (~ 1 mile). Airmasses form when air remains over a ­relatively flat region of the earth with homogeneous surface characteristics for an extended period of time. Areas with relatively uniform surfaces include continental arctic regions, such as Canada and ­Siberia; cool oceanic regions, such as the North Atlantic and Pacific; deserts, such as the Sahara and the American southwest; and tropical oceanic regions, including the equatorial Atlantic and Pacific, as well as smaller water bodies such as the Caribbean Sea and the Gulf of Mexico. The atmosphere “acquires” the thermal and moisture properties of the underlying surface as heat is transferred between the surface and the atmosphere and as moisture evaporates into the air from the surface. Meteorologists classify airmasses according to their thermal and moisture properties. Airmasses characterized by bitter cold temperatures are classified as arctic airmasses, cold temperatures (or cool in summer) as polar airmasses, and warm-hot temperatures as tropical airmasses. Airmasses that form over oceans are called maritime, and those that form over continents, continental. Continental airmasses are normally drier than maritime airmasses since relatively little surface water is evaporating into air over the continents. Figure 9.1 identifies the typical airmass source regions of North America. Arctic airmasses develop over Canada and the frozen Arctic Ocean in wintertime, generally poleward of about 60°N. Extremely cold airmasses can form as air continually cools in the near-perpetual darkness of winter. Continental polar airmasses continually develop over the northern parts of the North American continent in all seasons of the year. Maritime polar airmasses develop over the North Atlantic and North Pacific Oceans. The oceans moderate wintertime temperatures within these airmasses. Maritime tropical airmasses originate over the tropical Atlantic and Pacific, the Gulf of Mexico, and the Caribbean Sea. Continental tropical airmasses develop over the desert regions of Mexico and the southwestern United States. The centers of cold airmasses are associated with high pressure on surface weather maps. High pressure develops in response to cooling, as discussed in Chapter 8. In winter, high-pressure centers form and are the dominant features over the northern parts of the continents of Asia and North America. In summer, when the oceans are cooler than the landmasses, large high-pressure centers are the dominant feature of the atmosphere over the North Atlantic and Pacific Oceans. The ­high-pressure ­center over the Atlantic is called the Bermuda High because it is centered near Bermuda, while its Pacific counterpart is called the Pacific High. The centers of very warm airmasses appear as semi-permanent regions of low-surface ­pressure. These low-pressure areas appear over desert areas such as the American Southwest in summer, and in Southeast Asia, central Africa, and near the Property of Kendall Hunt Publishing Co. Chapter 9 from Rauber's Severe and Hazardous Weather 978-0-7575-9772-5 | 2012 Copyright www.kendallhunt.com/rauber Rauber_Severe_and_Hazardous_Weather04E_Ch09_Printer.indd 156 31/12/11 2:15 AM Chapter 9 Airmasses and Fronts Maritime polar airmass (cool moist) 157 Maritime polar airmass (cool moist) Continental polar or Arctic airmass (cold dry) Continental tropical airmass (warm dry) Maritime tropical airmass (warm moist) Maritime tropical airmass (warm moist) equator. In winter, semi-permanent low-pressure centers appear over the northern oceans. The semi-permanent low over the Pacific is called the Aleutian Low, while its Atlantic counterpart is called the Icelandic Low. Semi-permanent low-pressure centers differ substantially from migrating tropical and extratropical cyclones, although the latter often migrate into the areas of the semi-permanent lows. Airmasses do not remain over their source regions indefinitely. As storms move about the globe, airmasses move out of their source regions and over other areas. Arctic airmasses can move as far south as the Gulf of Mexico during a cold air outbreak. Maritime tropical air can extend well into Canada in midsummer. The arrows in Figure 9.1 show the typical paths North American airmasses take as they move out of their source regions. Once out of their source regions, the temperature and moisture characteristics change as the airmasses begin to acquire the thermal and moisture characteristics of the new surfaces over which they reside. For example, in summer, warm humid air over the Gulf of Mexico typically moves northward over the central United States. Over land, this air may heat several degrees and acquire additional moisture from crops through a process called evapotranspiration. By the time the air moves far inland, it can be considerably more uncomfortable than along the coast. Figure 9.1 Airmass source regions for North America and the typical tracks airmasses take out of their source regions. Not all airmasses are in contact with the ground. An example is the stratosphere, a large airmass that covers the entire globe. Airmasses exist aloft in the troposphere, residing on top of other airmasses in contact with the surface. Airmasses are three-dimensional, and the boundaries between airmasses are often quite sharp and distinct. These boundaries, called fronts, are meteorologically important because much of the precipitation in the middle latitudes, and most severe weather, occurs in their vicinity. Check Your Understanding 9.1 1. How wide and how deep is a typical airmass? 2. What characteristics make a region a good source for airmasses? 3. What are the different types of airmasses that affect North America? 4. What is the relationship between airmasses and fronts? Fronts Meteorologists classify fronts based on the thermal and moisture characteristics of the airmasses, the direction of movement of the airmasses, and Property of Kendall Hunt Publishing Co. Chapter 9 from Rauber's Severe and Hazardous Weather 978-0-7575-9772-5 | 2012 Copyright www.kendallhunt.com/rauber Rauber_Severe_and_Hazardous_Weather04E_Ch09_Printer.indd 157 31/12/11 2:15 AM 158 Chapter 9 Airmasses and Fronts whether the boundary between the airmasses is in contact with the ground (a surface front) or can only be found aloft (an upper level front). In most cases, two airmasses in contact with one another will have different thermal properties, one cold and the other warm. Cold Fronts We call the boundary between two airmasses a cold front if the cold air is advancing forward, ­lifting the warm air. The leading edge of the cold airmass typically has a shape like a dome, as shown in the top panel of Figure 9.2. Note that, because of the tilt of the airmass boundary in Figure 9.2, the front’s horizontal position varies with elevation. The type of precipitation that will occur along a cold front depends on the characteristics of the warm air ahead of the front. If the warm air is moist and conditionally unstable, lifting ahead of the front can trigger thunderstorms. These thunderstorms will often form in a line, called a squall line, along the front. In some situations, supercell thunderstorms may form along the front (see Chapter 18), with tornadoes, hail, and damaging winds. On the other hand, the atmosphere may be stable ahead of the cold front (middle panel of Figure 9.2). In this case, the clouds that form by lifting may only produce light rain, or no rain at all. In some cases, the warm air ahead of the front is dry (bottom panel of Figure 9.2). When this happens, no clouds will form at all. Regardless of the cloud formations, we say that the front is a cold front if the cold air is advancing, lifting the warm air ahead of it. When extratropical cyclones (lowpressure centers) form in the ­Northern Hemisphere, air flows around the low-pressure system counterclockwise. Cold air on the west side of the cyclone advances southward and then southeastward. For this reason, cold fronts are typically located in the southwest quadrant of a cyclone early in its lifetime (see Figure 9.3). Cold fronts that mark the boundary of extremely cold airmasses in wintertime are called arctic fronts. Arctic airmasses are normally much shallower than airmasses associated with spring and fall season cold fronts. Warm Fronts A boundary where the cold air is retreating and the warm air is advancing is called a warm front. Since warm air flows northward on the east side (A) Cold air advancing West Location of surface front Cold air advancing (B) West (C) Warm, moist conditionally unstable air Warm, moist stable air Location of surface front Cold air advancing West East East Warm, dry stable air Location of surface front East Figure 9.2 Cross section through three cold fronts. In the top panel, the air ahead of the front is conditionally unstable and forms thunderstorms when lifted. In the middle panel, stable moist air is lifted along the frontal surface. In the bottom panel, dry air is lifted, so clouds do not form. In all cases, the cold air is advancing into warmer air. of a cyclone, warm fronts are normally found in this location (see Figure 9.3). The cold air, in this case, still has a dome-like structure, although the ­cold-air dome typically slopes more gradually ahead of a warm front than behind a cold front (see Figure 9.4). The warm air flows toward the cold air, rising over the dome as it progresses northward. The type of precipitation that occurs along a warm front depends on the moisture and thermal characteristics of the warm air. In eastern North America, warm air gliding upward along a warm front typically ­originates over the Gulf of Mexico or the ­Atlantic and is normally moist. As the warm air glides upward over the cold-air dome, ­widespread layered clouds will develop. These clouds are Property of Kendall Hunt Publishing Co. Chapter 9 from Rauber's Severe and Hazardous Weather 978-0-7575-9772-5 | 2012 Copyright www.kendallhunt.com/rauber Rauber_Severe_and_Hazardous_Weather04E_Ch09_Printer.indd 158 31/12/11 2:15 AM Chapter 9 Airmasses and Fronts Cold dry airmasss 159 Warm front L (A) Cold front Line of thunderstorms Warm, moist conditionally Warm moist unstable air airmass Figure 9.3 Example of a cold front moving southeastward across the central United States. The cold air is lifting warm Coolhave air retreating moist conditionally unstable air, creating a line of thunderstorms along the front. This cold front would structure similar to Figure 9.2A. The figure also shows a warm front. NoteSouth the flow in the cold air north of the warm a Location of front has North component toward the north, so that the cold air is retreating northward with time. Shading denotes cloud cover. surface front (A) (B) Warm, moist conditionally unstable air Warm, moist stable air Cool air retreating South Location of surface front North Cool air retreating South Location of surface front North Figure (B) 9.4 Cross section through two warm fronts. In A, the air south of the front is conditionally unstable and forms showers and thunderstorms as it rises over the cool air. In B, the moist air south of the front is stable. In this case, the Warm, moist clouds form a wide stratus layer that is deepest near the surface position of the front and thin farther north. stable air deepest just north of the frontal boundary and progressively become thinner and higher toward the north. Precipitation is heaviest closer to the frontal boundary where the clouds are deep and lighter to the north where the clouds are shallow. The intenCool air retreating sity of the precipitation depends again on the stabilSouth North Location of ity of the warm air. If thesurface warm front air is conditionally unstable, thunderstorms may develop over the warm front (Figure 9.4A). These storms are often embedded within, or emerge from, the widespread layered clouds. If the warm air is stable, the clouds will be layered (Figure 9.4B). If the temperature in the cold air is below freezing, snow, ice pellets, or freezing rain may occur (see Chapter 12). Regardless of the cloud formations or precipitation, we say that a front is a warm front if the cold air is retreating and the warm air is advancing. Stationary Fronts Airmass boundaries are sometimes stationary. Although the boundary is stationary, air on both sides of the boundary can be moving. With a Property of Kendall Hunt Publishing Co. Chapter 9 from Rauber's Severe and Hazardous Weather 978-0-7575-9772-5 | 2012 Copyright www.kendallhunt.com/rauber Rauber_Severe_and_Hazardous_Weather04E_Ch09_Printer.indd 159 31/12/11 2:15 AM 160 Chapter 9 Airmasses and Fronts s­ tationary front, air on the cold side of the front will always be flowing parallel to the front (see Figures 9.5 and 9.6). If this is the case, the cold air is neither advancing nor retreating. The warm air normally flows toward the front. As the warm air encounters the cold air, it may be lifted along the boundary. If the air is conditionally unstable, a line of showers and thunderstorms may develop in the warm air over the front (Figures 9.5A and 9.6A), a situation that can lead to flash flooding (see H Cool air ion ar yf ro nt w St at Warm e air H (A) H n Cold air S ont ry fr na tatio s Warm air H (B) Figure 9.5 Maps showing two examples of stationary fronts and associated clouds (shading). Note that in both examples, the cold air on the north side of the front is moving parallel to the front. In (A), clouds form on the warm side of the front and precipitation would fall in this region. In (B), clouds form on the cold side of the front and any ­precipitation would fall out on the cold side. Property of Kendall Hunt Publishing Co. Chapter 9 from Rauber's Severe and Hazardous Weather 978-0-7575-9772-5 | 2012 Copyright www.kendallhunt.com/rauber Rauber_Severe_and_Hazardous_Weather04E_Ch09_Printer.indd 160 31/12/11 2:15 AM Chapter 9 Airmasses and Fronts (A) Cold air flowing out of paper, parallel to front West Warm, moist conditionally unstable air Location of surface front East (B) Warm, moist conditionally unstable air South Cold air flowing into paper, parallel to front Location North of surface front Figure 9.6 Two examples of cross sections through stationary fronts. In each case, the cold air is flowing parallel to the front, so the front is neither retreating nor advancing. In both cases shown, the warm air is conditionally unstable. In panel A, which corresponds to cross section w-e in Figure 9.5A, the warm air is lifted at the leading edge of the cold-air dome and showers erupt ahead of the front with rain falling in the warm air. In panel B, which corresponds to cross section s-n in Figure 9.5B, warm air flows up over the cold-air dome so that the showers occur over the front, with the rain falling out on the cold-air side of the front. ­ hapter 25) when the front’s lack of significant C movement allows heavy rain to persist over a particular location. If the warm air is stable, widespread layered clouds may form over the front, with rain falling on the cold side of the front. Regardless of the cloud formations or precipitation, we say that the front is a stationary front if the cold air is neither advancing nor retreating. Occluded Fronts As cyclones develop and go through their life cycle, the cold air to the west of the cyclone advances rapidly southward around the center of low pressure, while the air to the north of the warm front, which 161 is also cold, retreats northward slowly. Because the cold front typically moves rapidly, it will progress around the south side of the low-pressure center. The cold air will then progress northeastward, approaching the warm front. Eventually, the cold front can actually catch up and wrap into the warm front. When this happens, the cold air comes in direct contact with the cold air north of the warm front, creating a new airmass boundary. This boundary, between the cold air behind the cold front and the cold air north of the warm front, is called an occluded front. The process described above is depicted conceptually in Figure 9.7. We see the cold front progress southward and eastward (Figure 9.7A), where it eventually encounters the warm front (Figure 9.7B). The boundary between the two cold air regions becomes longer as the cold air behind the cold front continues to advance (Figure 9.7C). As the fronts meet, warm air is forced aloft over both the cold airmasses. The three-dimensional structure of an occluded front depends on the temperatures within the cold air behind the cold front and north of the warm front. Figure 9.7D shows two sets of cross sections through the fronts appearing in Figure 9.7C. The set on the left represents a cold occlusion. In this case, the air behind the cold front is colder than air north of the warm front. The lower cross section (u to v) is at a point where the cold front has not yet caught up to the warm front (see Figure 9.7C). The middle cross section (w to x) is located right at the point where the cold, warm, and occluded fronts meet. The top cross section (y to z) shows the occluded front. In the occluded region, cold air behind the cold front lifts the (less cold) air north of the warm front and the warm air riding on top of the cold airmasses. The set of cross sections on the right represents a warm occlusion. Warm occlusions develop when air north of the warm front is colder than the air behind the cold front. In this case, air behind the cold front ascends over the cold air north of the warm front. The warmest air again is found above the cold airmasses. Warm occlusions appear to be more common than cold occlusions. Occluded fronts develop during the mature and dissipating stages of cyclones. They are typically characterized by widespread cloudiness and rain or snowfall. Property of Kendall Hunt Publishing Co. Chapter 9 from Rauber's Severe and Hazardous Weather 978-0-7575-9772-5 | 2012 Copyright www.kendallhunt.com/rauber Rauber_Severe_and_Hazardous_Weather04E_Ch09_Printer.indd 161 31/12/11 2:15 AM 162 Chapter 9 Airmasses and Fronts (A) (B) Cold L L Cold Cold Cold Warm Warm (C) (D) Cold occlusion Warm occlusion Warm L y w 1 Cold 2 3 u Colder z z x v w Cross section 2 on panel C through the point where the cold and warm fronts meet Warm y Warm Cold Cold Colder Colder Cross section 1 on panel C across the occluded front Warm Colder v y Cross section 1 on panel C across the occluded front Warm z Cold x Warm Cold Cold x Cold Cross section 3 on panel C Cross section 2 on panel C through the point where the cold and warm fronts meet Cold u v Colder Warm w Colder Cross section 3 on panel C u Figure 9.7 The development of an occluded front. (A) The cold front moves faster than the warm front because the winds in the cold air behind the cold front are moving rapidly toward the front, while the cold air north of the warm front is primarily moving westward, with only a small component of motion away from the front toward the north. (B) As a result, the cold front “catches up” to the warm front. (C) Cold air completely surrounds the low-pressure center, with the occluded front marking the boundary between air behind the cold front and ahead of the warm front. (D) The vertical structure of an occlusion. Dark blue denotes air behind the cold front; light blue, air to the north of the warm front; and orange, the warm airmass. Each set of three cross sections corresponds to the cross sections shown in (C). The set to the left shows the alignment of airmasses when the coldest air is behind the cold front (a cold occlusion). The set to the right shows the alignment of airmasses when the coldest air is ahead of the warm front (a warm occlusion). In all cases, the warm air in the “warm sector” of the storm is forced aloft over both fronts. Dry Lines All the fronts discussed so far separate airmasses with different thermal properties, one airmass cold and the other warm. In the south-central United States (the Texas, Oklahoma, Kansas region) and northern Mexico, another type of airmass boundary develops that is primarily marked by a sharp moisture, rather than temperature difference between the two airmasses. A boundary characterized by a sharp moisture difference, but little temperature change, is called a dry line. Dry lines develop when air flowing eastward from the high desert plateau regions of Arizona, Colorado, New Mexico, and ­ exico descends the Rockies into the southern M plains and encounters moist air flowing northward from the Gulf of Mexico (Figure 9.8). The desert air typically has low moisture content because of its source region. When this air descends the east slope of the Rockies on its way to the plains, the air compresses, warms, and dries even more; by the time it reaches the High Plains, its relative humidity can be quite low (~20 to 30%). Air from the Gulf of Mexico, on the other hand, can be extremely humid. Moist air is less dense than dry air at the same temperature and pressure. This is true because the water molecule (H2O, molecular weight 18) has less mass Property of Kendall Hunt Publishing Co. Chapter 9 from Rauber's Severe and Hazardous Weather 978-0-7575-9772-5 | 2012 Copyright www.kendallhunt.com/rauber Rauber_Severe_and_Hazardous_Weather04E_Ch09_Printer.indd 162 31/12/11 2:15 AM Chapter 9 Airmasses and Fronts 163 Cold front Cold dry airmass advancing south A L Warm dry airmass descending mountains Warm front Dry line Warm dry air Pacific Ocean A B Warm moist airmass advancing northward Dry line Warm moist air Atlantic B Ocean Figure 9.8 A dry line develops as warm dry air descends the east side of the Rocky Mountains. Ahead of the dry line, warm moist air, which originated over the Gulf of Mexico, is lifted. In this example, the warm moist air ahead of the front is conditionally unstable so that lifting at the dry line triggers a line of thunderstorms as illustrated in the cross section below the map. Property of Kendall Hunt Publishing Co. Chapter 9 from Rauber's Severe and Hazardous Weather 978-0-7575-9772-5 | 2012 Copyright www.kendallhunt.com/rauber Rauber_Severe_and_Hazardous_Weather04E_Ch09_Printer.indd 163 31/12/11 2:15 AM 164 Chapter 9 Airmasses and Fronts than an oxygen molecule (O2, molecular weight 32), or a nitrogen molecule (N2, molecular weight 28). As water molecules displace nitrogen and oxygen molecules in a volume of air, air becomes less dense. When the dry air descending the Rockies meets the moist air on the plains, the moist air will rise over the dry air if the dry air is denser. If the moist air is conditionally unstable, lifting over the dry air may trigger instability and produce thunderstorms. Many times along the dry line, the dry air to the west will become warmer than the moist air to the east. This occurs, for example, because the moist airmass to the east may have a shallow cloud layer that reflects solar radiation, while the dry air is clear. Under these conditions, updrafts will develop preferentially on the dry air side of the boundary. These updrafts can become quite strong and often move over the moist air, drawing the moist air upward. By either mechanism, if the moist air rises to its level of free convection, it will form a line of thunderstorms along a dry line. Thunderstorms tend to develop along dry lines in the mid-afternoon when the moist air is warmest. Dry-line thunderstorms often become severe if the moist air is sufficiently unstable. Upper-Level Fronts rises and becomes saturated, cooling at the moist adiabatic lapse rate. The boundary where these two airstreams meet is characterized by a very sharp change in humidity and modest to little change in temperature. The reason there is often not a sharp temperature contrast across the upper-level front is that the descending airstream has warmed dry adiabatically, and the ascending airstream cooled moist adiabatically, to nearly the same temperature at the boundary where the airmasses meet. The upper-level front does not appear as a sharp boundary in surface temperature or moisture fields, since it does not extend to the surface. As the moist air east of the upper-level front is lifted by the dry air advancing from the west, strong thunderstorms can be triggered along the upper-level front. In general, an upper-level front is likely to be present if 1) a sharp line of storms exists with clear air to the west of the line, and 2) no significant change in the temperature or dewpoint temperature appears at the surface across the line of storms. Upper-level fronts develop in the same general region as dry lines. The primary distinction between these two fronts is that dry lines are surface based, while upper-level fronts are only found aloft. Air west of the dry line originates at low levels over the high plateau of the desert southwest. Air west of an upper level front originates in the upper troposphere and lower stratosphere. In Chapters 10 and 11, we will examine how all of the fronts discussed in this chapter form and how they move and interact as extratropical cyclones develop and progress through their life cycles. Airmasses do not necessarily extend to the surface of the earth. Often, airmasses can be “stacked” in the vertical, so that an airmass boundary will be present aloft, but not at the surface. Meteorologists call this type of airmass boundary a cold front aloft or an upper-level front (Figure 9.9). In this text, we will adopt the term “upper-level front” for this type of front to avoid confusion with surMETEOROLOGY IN ACTION: face cold fronts. Upper-level fronts are quite comFINDING COLD AND WARM FRONTS mon features within cyclones that form east of the IN SURFACE DATA Rockies. Upper-level fronts develop when two airmasses aloft meet. The first airmass originates in the convergent (west) side of a trough in the upper Check Your Understanding 9.2 troposphere. This air, located near the top of the tro1. What are the three criteria used to classify posphere or even in the lower stratosphere, is very fronts? cold. However, as the air descends in response to 2. What are the six different types of fronts? How the convergence aloft, it warms at the dry adiabatic are they depicted on weather maps? lapse rate, dries, and is carried eastward by the jetstream winds. The airmass ahead of the upper-level 3. For each of the six fronts, which airmass is most front originates in the lower troposphere east of the dense and which airmass is lifted? trough axis. This air, which initially is quite warm, Property of Kendall Hunt Publishing Co. Chapter 9 from Rauber's Severe and Hazardous Weather 978-0-7575-9772-5 | 2012 Copyright www.kendallhunt.com/rauber Rauber_Severe_and_Hazardous_Weather04E_Ch09_Printer.indd 164 31/12/11 2:15 AM Chapter 9 Airmasses and Fronts 165 L A B Descending dry air Upper-level from upper troposphere front Pacific Ocean A Front does not extend to surface Ascending moist air from lower troposphere (flowing into page) Atlantic B Ocean Figure 9.9 This figure illustrates both surface conditions and the upper tropospheric height pattern when an upperlevel front is present. Cloud cover is depicted by shading. The solid orange lines denote height contours on the 500 mb surface. The lower panel of the figure shows the upper-level front in cross section AB. Finding Fronts on Weather Maps lines are used to indicate that a front is either forming or dissipating. Although a frontal symbol exists for an upper-level front, it rarely is used. Recognition of the importance of upper-level fronts in Meteorologists indicate the location and type of severe weather is relatively recent in meteorology. front on surface weather maps using a heavy line The symbols for all of the fronts discussed in this with either barbs or half circles along the line. Solid Property of Kendall Hunt Publishing Co. chapter appear in Figure 9.10. lines are used when a front is obvious, while broken Chapter 9 from Rauber's Severe and Hazardous Weather 978-0-7575-9772-5 | 2012 Copyright www.kendallhunt.com/rauber Rauber_Severe_and_Hazardous_Weather04E_Ch09_Printer.indd 165 31/12/11 2:15 AM 166 Chapter 9 Airmasses and Fronts Figure 9.10 Frontal symbols used on surface weather maps. How do meteorologists determine where to place these frontal symbols to indicate the position of fronts? Imagine driving on a highway toward a cold front. The temperature outside the car would remain warm until the moment the car crossed into the cold airmass. At that point, the outside temperature would begin to drop, continuing to fall as the car moved farther into the cold airmass. Where would the position of the cold front be? The cold front would be located at the point on the highway where the temperature began to fall rapidly. On surface maps such as Figure 9.11, meteorologists often plot contours of temperature. The position of the leading edge of a cold airmass, and therefore the front, can be found on such maps by examining temperature gradients (the change of temperature with distance). A cold, warm, or stationary front will be located on the warm edge of a sharp temperature gradient. In many cases, lower dewpoint temperatures will also be found on the cold air side of a cold, warm, or stationary front. For this reason, the leading edge of a sharp gradient in the dewpoint temperature can also be used to identify fronts. Other data can also be used to identify fronts. Fronts often are marked by a sharp shift in wind direction or a change in wind speed. Sharp changes in wind direction and speed between nearby stations on weather maps are often the best indicators of frontal positions. Fronts typically align with troughs in the surface pressure field (see cold front in Figure 9.11). Characteristic frontal weather, such as a line of showers or thunderstorms, or a transition from a clear to a cloudy sky, also helps mark frontal locations. One can determine whether a front is a cold, warm, or stationary front by carefully examining the wind direction at stations near the front on its cold side. If the wind on the cold side blows toward the front, it is a cold front; away from the front, a warm front; and along the front, a stationary front. Occluded fronts develop late in the life of cyclones. Occluded fronts typically coincide with a sharp wind shift, with cold air on both sides of the boundary marked by the wind shift. Widespread clouds and light to moderate precipitation often accompany occluded fronts. Figure 9.11 Analysis of sea level pressure and surface temperature on a winter day in December. Note the effects of cold air trapping in the ­Appalachians and cold air damming on the east side of the Rocky Mountains. Property of Kendall Hunt Publishing Co. Chapter 9 from Rauber's Severe and Hazardous Weather 978-0-7575-9772-5 | 2012 Copyright www.kendallhunt.com/rauber Rauber_Severe_and_Hazardous_Weather04E_Ch09_Printer.indd 166 31/12/11 2:16 AM Chapter 9 Airmasses and Fronts Dry lines appear as sharp gradients in dewpoint temperature and are most common in the southcentral United States east of the Rockies. Be careful not to confuse cold fronts with dry lines when looking at dewpoint temperature maps. Cold fronts have sharp surface temperature and dewpoint gradients day and night, while dry lines show up in daytime with strong surface dewpoint gradients but weak or no temperature gradients. At night, dry lines appear in surface data more like cold fronts. The reason for this diurnal change has to do with the difference between the daily cycle of heating and cooling on the west and east side of a dry line. The surface temperature on the dry side of a dry line undergoes rapid change from day to night because the skies are clear and dry. The moist side of a dry line is often hazy or cloudy and typically experiences small diurnal changes in surface temperature. Dry lines are typically marked by a wind shift, with southerly winds to the east and westerly winds to the west of the boundary. Upper-level fronts are only found aloft and are therefore difficult to identify on surface maps. An important signature of an upper-level front is a pressure trough in the surface data. This pressure trough may also have with it a slight wind shift. Upper-level fronts also coincide with lines of showers and precipitation. In general, if a line of showers moves over a region and surface conditions change little from before to after the passage of the line, there is a good chance that an upper-level front has passed. If it appears from surface data that an upper-level front has passed, the existence of the front aloft can be confirmed by examining the humidity and temperature on upper-level charts such as the 700 or 500 mb chart. The Rocky Mountains in western North America extend from northern Canada into Mexico. Cold airmasses flowing southward from central Canada are often so shallow that they cannot flow westward over the Rockies, which act like a dam, trapping cold air on their east side. On surface 167 weather maps, meteorologists draw stationary fronts to indicate the western edge of cold airmasses dammed along the mountains. These stationary fronts are not boundaries between airmasses, but rather, are boundaries between air and rock (see Figure 9.11). Cold air damming also occurs on the east side of the Appalachians. When cold continental air arrives on the east side of the Appalachians, warm moist air moving westward off the Atlantic sometimes forces the cold air into a narrow wedge between the coastline and the Appalachian mountain chain. The Appalachian Mountains can also affect the configuration of surface fronts by trapping cold air in valleys. The Appalachians consist of parallel ridges and valleys that extend from Georgia and Alabama to Maine. Often, after a cold airmass moves across the eastern United States, cold air will settle into the Appalachian valleys. When a new storm system approaches from the west, warm air will advance northward on both the west and east sides of the Appalachian chain, leaving the denser cold air trapped in the interior valleys. Meteorologists indicate cold air damming and trapping by drawing distorted warm fronts that wrap southward around the west side of the Appalachians and northward again on the east side. The effects of cold air damming by the Rocky Mountains and damming and trapping in the Appalachians both appear on the wintertime surface map shown in Figure 9.11. Figures 9.7 through 9.9 also imply damming of cold air by the Rocky Mountains. Check Your Understanding 9.3 1. List at least five variables that can be used to identify the position of fronts on weather maps. 2. Where do cold air damming and cold air trapping typically occur? 3. How would you identify a dry line on a map of station reports? Property of Kendall Hunt Publishing Co. Chapter 9 from Rauber's Severe and Hazardous Weather 978-0-7575-9772-5 | 2012 Copyright www.kendallhunt.com/rauber Rauber_Severe_and_Hazardous_Weather04E_Ch09_Printer.indd 167 31/12/11 2:16 AM 168 Chapter 9 Airmasses and Fronts TEST YOUR UNDERSTANDING 1. What are the primary airmass source regions affecting North America? 2. What type of surface weather (tempera- ture, intensity and type of precipitation, wind direction) would a person experience during the passage of a cold front, a warm front, an occluded front, a dry line, and an upper-level front? 3. What is the difference between a cold front and an arctic front? 4. Draw a vertical cross section through a cold front. Label the cold and warm airmasses, and draw in clouds and precipitation for different stability conditions. 5. Draw a vertical cross section through a warm front. Label the cold and warm airmasses, and draw in clouds and precipitation for different stability conditions. 6. What direction does the cold air move relative to a cold front and a warm front? 7. How does an occluded front develop? 8. What is the difference between a warm occlusion and a cold occlusion? 9. Where is warm air found in the vicinity of 12. Explain why air can be lifted along a dry line when there is no temperature difference between the airmasses on either side of the boundary. 13. Why is a dry line often more detectable during daytime than at night? 14. Draw a vertical cross section through a dry line. Draw in clouds and precipitation where they would occur. 15. Draw a cross section through an upper-level front. Draw in clouds and ­precipitation where you would expect them to occur. 16. How do the surface temperature and dew- point temperature vary across an upperlevel front? 17. What type of front is often associated with flash-flooding events? 18. Meteorologists often look at maps depict- ing data in station model format (rather than contoured data of temperature, dewpoint, or pressure) to help pinpoint frontal locations. Explain why. 19. Explain why maps depicting surface temperature contours are not very helpful in identifying dry lines and upper-level fronts. 20. Why does cold air trapping occur in an occluded front? regions such as the Appalachians? 10. What is a dry line? 11. Why are dry lines most commonly found in Texas, Oklahoma, and Kansas? Property of Kendall Hunt Publishing Co. Chapter 9 from Rauber's Severe and Hazardous Weather 978-0-7575-9772-5 | 2012 Copyright www.kendallhunt.com/rauber Rauber_Severe_and_Hazardous_Weather04E_Ch09_Printer.indd 168 31/12/11 2:16 AM Chapter 9 Airmasses and Fronts 169 TEST YOUR PROBLEM-SOLVING SKILLS 1. The forecasts listed below describe an (b) a day when Indianapolis was influenced by an airmass originating in central Canada. overnight frontal passage. Identify the type of front expected to pass through the area. (a) Cool today with light, steady rain and winds from the northeast. Warmer tomorrow with clearing skies and precipitation ending. Winds will shift to southerly. (b) Scattered showers today with temperatures in the 70s and light southeast winds. A chance of thunderstorms this evening with some becoming severe. Tomorrow will be much colder with temperatures in the 50s, clearing skies, and winds shifting to northwesterly. (c) Hot and humid today with scattered thunderstorms. Tomorrow, expect continued high temperatures but with drier conditions and clearing skies. Overnight winds will shift from southeasterly to southwesterly. (d) High temperatures today only near 45 with overcast skies and rain showers. Winds will be out of the east. Tomorrow will be cooler with highs only in the high 30s. Continued cloudy skies and rain with winds shifting to northwesterly. (e) Hot and humid today with temperatures reaching into the high 80s. Winds from the south. Strong thunderstorms tonight. Hot and humid conditions will persist after the thunderstorms pass. 2. The following table contains the 1:00 pm temperatures and dewpoints for a 20-day period during May at Indianapolis, Indiana. Use the tabulated data to determine the following: (a) a day when Indianapolis was influenced by an airmass originating in the North Atlantic. (c) a day when Indianapolis was influenced by an airmass originating in the Gulf of Mexico. (d) a day when Indianapolis was influenced by an airmass originating in the United States desert southwest. (e) a 24-hour period when a cold front passed through Indianapolis. (f ) a 24-hour period when a warm front passed through Indianapolis. Date Temp. (° F) May 1 58 46 May 2 60 40 May 3 62 41 May 4 77 58 May 5 82 67 May 6 83 72 May 7 68 42 May 8 55 32 May 9 61 41 May 10 63 48 May 11 57 51 May 12 52 51 May 13 59 52 May 14 67 60 May 15 72 52 May 16 81 47 May 17 92 45 May 18 91 53 May 19 87 62 May 20 75 58 3. The warm front shown in Figure 9.3 stretches from Cape Hatteras, North Carolina, to St. Joseph, Missouri, passing through southern Illinois (latitude 37°N). Assume a typical warm frontal slope of 1:200 (see Figure 9.4): (a) Approximately how far above the surface is the warm Property of Kendall Hunt Publishing Co. Chapter 9 from Rauber's Severe and Hazardous Weather 978-0-7575-9772-5 | 2012 Copyright www.kendallhunt.com/rauber Rauber_Severe_and_Hazardous_Weather04E_Ch09_Printer.indd 169 Dewpoint (° F) continued 31/12/11 2:16 AM 170 Chapter 9 Airmasses and Fronts front at Peoria, Illinois (40°N), Milwaukee, ­Wisconsin (43°N), and Marquette, Michigan (46°N)? (b) What types of clouds are likely to be present over Peoria, Milwaukee, and Marquette? (c) The cold front in Figure 9.3 stretches from the Oklahoma/Arkansas border through southern Texas. Oklahoma City is approximately 200 miles behind the surface front. Assuming a typical cold frontal slope of 1:75, how deep is the cold air over Oklahoma City? 4. Figure 9.7B shows a frontal system in which the occlusion process is just about to begin. Suppose the cold front is moving at 40 mph and the warm front is moving at 15 mph. Using a ruler to estimate distances, determine the approximate length of the occluded front six hours later. (Hint: The cold front will catch up to the warm front wherever the initial separation distance of the two fronts is less than 6 hours × the difference in frontal speeds. For reference, the cold front’s shaded cloud band in Figure 9.7B is approximately 150 miles wide in Indiana and Kentucky.) 5. Consider a dry line moving downslope (west to east) across Texas. In the air behind the dry line, suppose that 0.5% of the air molecules are water vapor; while in the moist airmass ahead of the dry line, 3% of the molecules are water vapor. (In both cases, suppose the remaining molecules are all O2 and N2 in their usual ratio, 3.7 nitrogen molecules per 1 oxygen molecule.) If the temperatures and pressures are the same on either side of the dry line, what is the ratio of the densities of the two airmasses? (Be sure to indicate which airmass is the denser one.) Property of Kendall Hunt Publishing Co. Chapter 9 from Rauber's Severe and Hazardous Weather 978-0-7575-9772-5 | 2012 Copyright www.kendallhunt.com/rauber Rauber_Severe_and_Hazardous_Weather04E_Ch09_Printer.indd 170 31/12/11 2:16 AM
