M E 345 Professor John M. Cimbala Lecture 20
advertisement
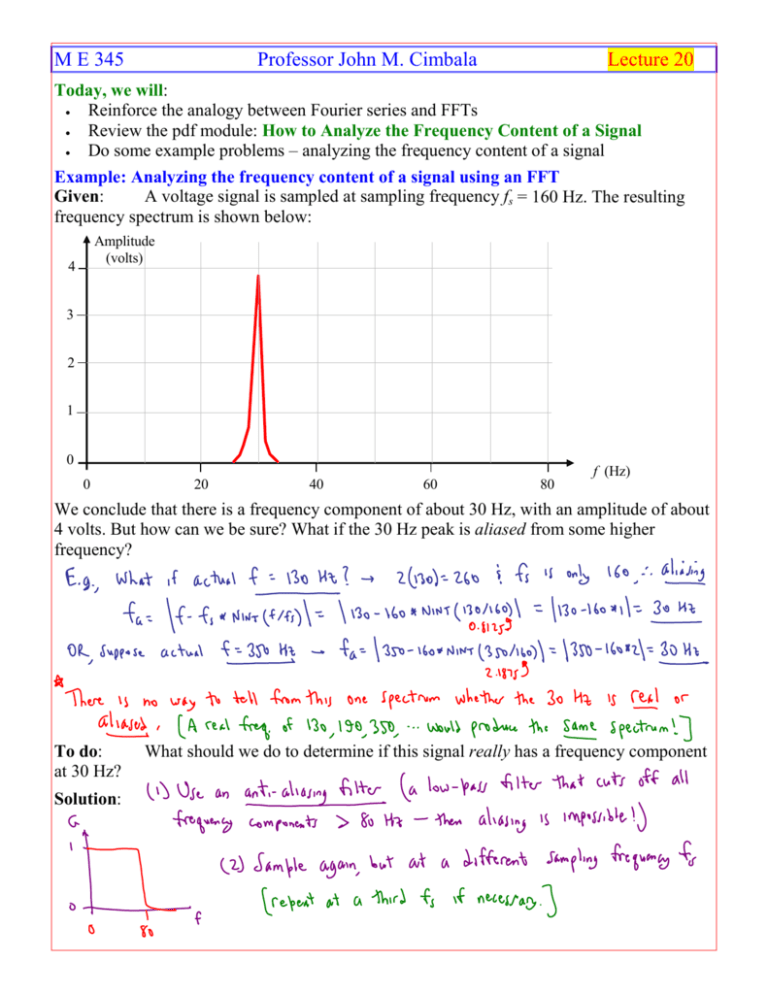
M E 345 Professor John M. Cimbala Lecture 20 Today, we will: • Reinforce the analogy between Fourier series and FFTs • Review the pdf module: How to Analyze the Frequency Content of a Signal • Do some example problems – analyzing the frequency content of a signal Example: Analyzing the frequency content of a signal using an FFT Given: A voltage signal is sampled at sampling frequency fs = 160 Hz. The resulting frequency spectrum is shown below: Amplitude (volts) 4 3 2 1 0 0 20 40 60 80 f (Hz) We conclude that there is a frequency component of about 30 Hz, with an amplitude of about 4 volts. But how can we be sure? What if the 30 Hz peak is aliased from some higher frequency? To do: at 30 Hz? Solution: What should we do to determine if this signal really has a frequency component Analogy between Fourier series and FFT (or DFT): Fourier Series: f(t) (volts) Amplitude (volts) Time trace 4 Harmonic amplitude plot 3 2 1 T T f (Hz) 0 time 0 f0 2f0 3f0 4f0 5f0 6f0 7f0 8f0 FFT: f(t) (volts) Amplitude (volts) Time trace Last data point is a “ghost” point (not used) 4 Frequency spectrum 3 2 1 T f (Hz) 0 time 0 Δf 2Δf 3Δf 4Δf 5Δf 6Δf 7Δf 8Δf Example: FFTs Given: A voltage signal is sampled at two different sampling frequencies, 100 Hz and 160 Hz. The resulting frequency spectra are shown below: • At fs = 100 Hz, two spikes appear in the frequency spectrum, at 20 and 40 Hz. Amplitude (volts) 4 3 2 1 0 f (Hz) 0 • 20 40 At fs = 160 Hz, two spikes appear in the frequency spectrum, at 20 and 60 Hz. Amplitude (volts) 4 3 2 1 0 0 To do: Solution: 20 40 60 80 f (Hz) Determine the frequencies most likely to actually be in the signal. Example: FFTs Given: A voltage signal is sampled at two different sampling frequencies, 300 Hz and 600 Hz. The resulting frequency spectra are shown below: • At fs = 300 Hz, a spike appears in the frequency spectrum at 120 Hz. Amplitude (volts) 4 3 2 1 f (Hz) 0 0 • 25 50 75 100 125 150 At fs = 600 Hz, a spike appears in the frequency spectrum, at 120 Hz. Amplitude (volts) 4 3 2 1 0 f (Hz) 0 To do: Solution: 50 100 150 200 250 300 Determine the frequency most likely to actually be in the signal.

