World Bioplastics
advertisement
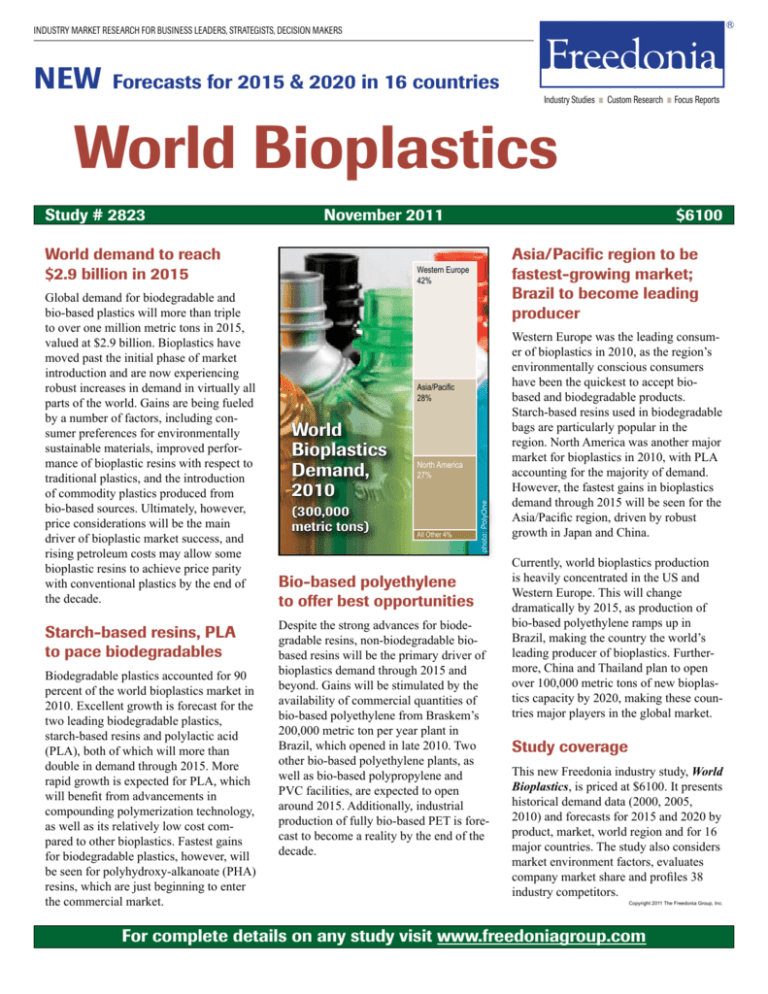
INDUSTRY MARKET RESEARCH FOR BUSINESS LEADERS, STRATEGISTS, DECISION MAKERS NEW Forecasts for 2015 & 2020 in 16 countries Industry Studies ■ Custom Research ■ Focus Reports World Bioplastics November 2011 World demand to reach $2.9 billion in 2015 Global demand for biodegradable and bio-based plastics will more than triple to over one million metric tons in 2015, valued at $2.9 billion. Bioplastics have moved past the initial phase of market introduction and are now experiencing robust increases in demand in virtually all parts of the world. Gains are being fueled by a number of factors, including consumer preferences for environmentally sustainable materials, improved performance of bioplastic resins with respect to traditional plastics, and the introduction of commodity plastics produced from bio-based sources. Ultimately, however, price considerations will be the main driver of bioplastic market success, and rising petroleum costs may allow some bioplastic resins to achieve price parity with conventional plastics by the end of the decade. Starch-based resins, PLA to pace biodegradables Biodegradable plastics accounted for 90 percent of the world bioplastics market in 2010. Excellent growth is forecast for the two leading biodegradable plastics, starch-based resins and polylactic acid (PLA), both of which will more than double in demand through 2015. More rapid growth is expected for PLA, which will benefit from advancements in compounding polymerization technology, as well as its relatively low cost compared to other bioplastics. Fastest gains for biodegradable plastics, however, will be seen for polyhydroxy-alkanoate (PHA) resins, which are just beginning to enter the commercial market. $6100 Asia/Pacific region to be fastest-growing market; Brazil to become leading producer Western Europe 42% Asia/Pacific 28% World Bioplastics Demand, 2010 (300,000 metric tons) North America 27% All Other 4% photo: PolyOne Study # 2823 Bio-based polyethylene to offer best opportunities Despite the strong advances for biodegradable resins, non-biodegradable biobased resins will be the primary driver of bioplastics demand through 2015 and beyond. Gains will be stimulated by the availability of commercial quantities of bio-based polyethylene from Braskem’s 200,000 metric ton per year plant in Brazil, which opened in late 2010. Two other bio-based polyethylene plants, as well as bio-based polypropylene and PVC facilities, are expected to open around 2015. Additionally, industrial production of fully bio-based PET is forecast to become a reality by the end of the decade. Western Europe was the leading consumer of bioplastics in 2010, as the region’s environmentally conscious consumers have been the quickest to accept biobased and biodegradable products. Starch-based resins used in biodegradable bags are particularly popular in the region. North America was another major market for bioplastics in 2010, with PLA accounting for the majority of demand. However, the fastest gains in bioplastics demand through 2015 will be seen for the Asia/Pacific region, driven by robust growth in Japan and China. Currently, world bioplastics production is heavily concentrated in the US and Western Europe. This will change dramatically by 2015, as production of bio-based polyethylene ramps up in Brazil, making the country the world’s leading producer of bioplastics. Furthermore, China and Thailand plan to open over 100,000 metric tons of new bioplastics capacity by 2020, making these countries major players in the global market. Study coverage This new Freedonia industry study, World Bioplastics, is priced at $6100. It presents historical demand data (2000, 2005, 2010) and forecasts for 2015 and 2020 by product, market, world region and for 16 major countries. The study also considers market environment factors, evaluates company market share and profiles 38 industry competitors. Copyright 2011 The Freedonia Group, Inc. For complete details on any study visit www.freedoniagroup.com Table of Contents/ List of Tables & Charts Introduction Executive Summary 1 Summary Table Market Environment General World Economic Overview Recent Historical Trends World Economic Outlook World Population Outlook World Manufacturing Outlook World Agricultural Outlook Maize Sugar Crops World Plastics Overview Plastics Demand Plastics Production Pricing Trends World Packaging Outlook Regulatory & Environmental Considerations Degradability Standards & Certification Composting & Recycling Legislation Food Versus Industrial Crop Use LIST OF TABLES & CHARTS: 1 World Gross Domestic Product by Region 2 World Population by Region 3 World Manufacturing Value Added by Region Cht World Maize Production by Region, 2010 Cht World Sugar Crop Production by Region, 2010 4 World Agricultural Value Added by Region 5 World Plastic Resin Demand by Region Cht World Plastic Resin Demand by Region, 2010 6 World Plastic Resin Production by Region 7 Plastic Resin Pricing Cht Plastic Resin Pricing, 2000-2020 8 World Packaging Demand by Region WORLD BIOPLASTICS OVERVIEW General Product Overview Biodegradable Starch-Based Resins Polylactic Acid Polyester Bioplastics PHAs Other Non-Biodegradable Market Overview Packaging Packaging Film Containers Loose-Fill & Other Nonpackaging Bags Foodservice Disposables Automotive & Electronics Agricultural Films Other Regional Overview Demand Production Trade Flows LIST OF TABLES & CHARTS: 1 World Bioplastics Demand by Type 2 World Biodegradable Plastics Demand by Type Cht World Biodegradable Plastics Demand by Type, 2000-2020 3 World Starch-Based Resin Demand by Region & Market 4 World Polylactic Acid Demand by Region & Market 5 World Polyester Bioplastic Demand by Region & Market Industry Study with Forecasts for 2015 & 2020 #2823 - World Bioplastics 6 World PHA Resin Demand by Region & Market 7 World Other Biodegradable Plastic Resin Demand by Region & Market 8 World Non-Biodegradable Bioplastics Demand by Type Cht World Non-Biodegradable Bioplastics Demand by Type, 2000-2020 9 World Bio-Based Polyethylene Demand by Region & Market 10 World Bio-Based Polyamide Demand by Region & Market 11 World Other Non-Biodegradable Bioplastics Demand by Region & Market 12 World Bioplastics Demand by Market 13 World Packaging Demand for Bioplastics by Application & Region Cht World Packaging Demand for Bioplastics by Application, 2010 14 World Nonpackaging Demand for Bioplastics by Application & Region Cht World Nonpackaging Demand for Bioplastics by Application, 2010 15 World Bioplastics Demand by Region Cht World Bioplastics Demand by Region, 2000-2020 16 World Bioplastics Production by Region Cht World Bioplastics Production by Region, 2000-2020 17 World Bioplastics Net Exports by Region NORTH AMERICA General Bioplastics Demand United States Canada Mexico LIST OF TABLES & CHARTS: 1 North America -- Bioplastics Supply & Demand 2 North America -- Bioplastics Demand by Type & Market Cht North America Bioplastics Demand by Country, 2010 3 United States -- Bioplastics Supply & Demand 4 United States -- Bioplastics Demand by Type 5 United States -- Bioplastics Demand by Market 6 Canada -- Bioplastics Supply & Demand 7 Canada -- Bioplastics Demand by Type 8 Canada -- Bioplastics Demand by Market 9 Mexico -- Bioplastics Supply & Demand 10 Mexico -- Bioplastics Demand by Type 11 Mexico -- Bioplastics Demand by Market WESTERN EUROPE General Bioplastics Demand Germany Italy United Kingdom France Netherlands Other Western Europe Belgium Norway All Other LIST OF TABLES & CHARTS: 1 Western Europe -- Bioplastics Supply & Demand 2 Western Europe -- Bioplastics Demand by Type & Market Cht Western Europe Bioplastics Demand by Country, 2010 3 Germany -- Bioplastics Supply & Demand 4 Germany -- Bioplastics Demand by Type 5 Germany -- Bioplastics Demand by Market 6 Italy -- Bioplastics Supply & Demand 7 Italy -- Bioplastics Demand by Type 8 Italy -- Bioplastics Demand by Market 9 United Kingdom -- Bioplastics Supply & Demand 10 United Kingdom -- Bioplastics Demand by Type 11 United Kingdom -- Bioplastics Demand by Market 12 France -- Bioplastics Supply & Demand 13 France -- Bioplastics Demand by Type 14 France -- Bioplastics Demand by Market 15 Netherlands -- Bioplastics Supply & Demand 16 Netherlands -- Bioplastics Demand by Type 17 Netherlands -- Bioplastics Demand by Market 18 Other Western Europe -- Bioplastics Supply & Demand 19 Other Western Europe -- Bioplastics Demand by Country & Type 20 Other Western Europe -- Bioplastics Demand by Market ASIA/PACIFIC General Bioplastics Demand Japan China Taiwan South Korea Other Asia/Pacific Australia All Other LIST OF TABLES & CHARTS: 1 Asia/Pacific -- Bioplastics Supply & Demand 2 Asia/Pacific -- Bioplastics Demand by Type & Market Cht Asia/Pacific Bioplastics Demand by Country, 2010 3 Japan -- Bioplastics Supply & Demand 4 Japan -- Bioplastics Demand by Type 5 Japan -- Bioplastics Demand by Market 6 China -- Bioplastics Supply & Demand 7 China -- Bioplastics Demand by Type 8 China -- Bioplastics Demand by Market 9 Taiwan -- Bioplastics Supply & Demand 10 Taiwan -- Bioplastics Demand by Type 11 Taiwan -- Bioplastics Demand by Market 12 South Korea -- Bioplastics Supply & Demand 13 South Korea -- Bioplastics Demand by Type 14 South Korea -- Bioplastics Demand by Market 15 Other Asia/Pacific -- Bioplastics Supply & Demand 16 Other Asia/Pacific -- Bioplastics Demand by Country & Type 17 Other Asia/Pacific -- Bioplastics Demand by Market OTHER REGIONS Central & South America: General Bioplastics Demand Brazil Other Central & South America Eastern Europe Africa/Mideast LIST OF TABLES & CHARTS: 1 Central & South America -- Bioplastics Supply & Demand 2 Central & South America -- Bioplastics Demand by Type & Market 3 Brazil -- Bioplastics Supply & Demand 4 Brazil -- Bioplastics Demand by Type 5 Brazil -- Bioplastics Demand by Market 6 Other Central & South America - Bioplastics Supply & Demand 7 Other Central & South America - Bioplastics Demand by Type 8 Other Central & South America - Bioplastics Demand by Market 9 Eastern Europe -- Bioplastics Supply & Demand 10 Eastern Europe -- Bioplastics Demand by Country & Type 11 Eastern Europe -- Bioplastics Demand by Market 12 Africa/Mideast -- Bioplastics Supply & Demand Industry Studies ■ Custom Research ■ Focus Reports INDUSTRY MARKET RESEARCH: BUSINESS INTELLIGENCE FOR BUSINESS LEADERS, STRATEGISTS, DECISION MAKERS 13 Africa/Mideast -- Bioplastics Demand by Type 14 Africa/Mideast -- Bioplastics Demand by Market asia/pacific INDUSTRY STRUCTURE Gains in bioplastics demand will benefit from rising incomes among China’s urban consumers, concerns over solid waste disposal and pollution issues, and nascent government efforts to promote environmental sustainability, including bio-based and biodegradable products. Additionally, a number of bioplastic-containing products are manufactured in China and then exported to the US or Western Europe, a trend which will drive demand for bioplastic Data plastics, illustrated withresins theand aidPLA of resins in China. Among biodegradable starch-based are the leading products in China, each accounting for about 20 percent of 2010 over 100 tables and charts demand. Other products such as cellophane and PHAs are also significant. PLA is expected to see strong growth in demand through 2015, particularly as the resin becomes more widely available in China, as domestic production capacity is expected to rapidly increase. PHA resins will also see healthy gains in demand in China. The most rapid growth, however, will be for non-biodegradable bioplastics, particularly bio-based polyethylene and PVC, but also bio-based polyamides to a lesser extent. General Market Share Mergers & Acquisitions Manufacturing Requirements Research & Development Marketing Strategies Channels of Distribution Competitive Strategies Cooperative Agreements LIST OF TABLES & CHARTS: 1 Bioplastics Sales by Company, 2010 Cht World Bioplastics Market Share, 2010 2 Selected Acquisitions & Divestitures 3 Selected Cooperative Agreements SAMPLE TEXT Company Profiles TABLE VI-7 CHINA -- BIOPLASTICS DEMAND BY TYPE (thousand metric tons) COMPANY PROFILES Profiles 38 global players such as Arkema, NatureWorks, Metabolix, BASF, Innovia Films, Novamont and Rodenburg Biopolymers Item Plastic Resin Demand kg bioplastic/ton plastic Bioplastics Demand Biodegradable: Starch-Based Resins Polylactic Acid Other Biodegradable Non-Biodegradable: Bio-Based Polyamide Bio-Based Polyethylene Other Non-Biodegradable world bioplastics overview Polylactic Acid Polylactic acid demand is forecast to expand 18.4 percent yearly through 2015 to 230,000 metric tons, valued at $520 million. Gains will be driven by improved product performance through blending and compounding, greater to support each processorExplanations familiarity and a widening composting network in many parts of the world. Additionally, PLA availability through numerous capacity table’sincreased data and forecasts additions around the world will aid in reducing resin prices and benefit market acceptance. Restraining further advances will be the limited biodegradability of PLA (which only degrades in high-temperature industrial compost environments) versus other bioplastics, as well as difficulty in recycling the resin, both of which limit the positive environmental profile of PLA to some extent. Copyright 2011 The Freedonia Group, Inc. SAMPLE TEXT Copyright 2011 The Freedonia Group, Inc. 2005 2010 2015 2020 24500 38250 58550 85000 113000 0.08 0.21 0.48 1.15 2.92 SAMPLE TABLE 2 8 28 98 330 1 6 25 67 170 0 2 10 28 68 0 2 8 24 64 1 2 historical 7 15 38 Presents data160 1 2 3 31 1 2 3 5 for 2000, 20050 and20 20101007 0 0 0 Freedonia 0 0 forecasts 6 53 plus for 2015 and 2020 • Establishing consistent economic and market forecasts • Using input/output ratios, flow charts and other economic methods to quantify data • Employing in-house analysts who meet stringent quality standards • Interviewing key industry participants, experts and end users Prior to the early 1990s, PLA was too expensive to be commercially feasible for large-scale applications, so its use was limited largely to specialized applications like biomedical devices, sutures and surgical implants. However, as a result of advancing biotechnology and rising conventional plastic prices, PLA has become cost-competitive with conventional polyolefin and polyester resins. PLA is frequently blended with starch, although blends tend to be brittle and 2000 Freedonia’s methods involve: Polylactic acid, a linear aliphatic polyester, is produced by the polymerization of lactic acid, which is made by the fermentation of sugars obtained from renewable resources such as maize and sugar crops. This material has a low moisture vapor transmission rate, high clarity and good strength. PLA is a thermoplastic material that can be processed by a number of techniques such as injection molding, blow molding, extrusion and thermoforming. PLA can be made into flexible or rigid products and is inherently clear, but can be processed to be opaque (but the resin is compostable, although only in high-temperature composting processes). The material can also be spun into fibers. The main drawback to PLA is its low thermal stability, which prevents usage at temperatures higher than 50 degrees Celsius. PLA also has poor carbon dioxide barrier -- making it unsuitable for carbonated drink bottles -- and low impact resistance. • Researching a proprietary database that includes trade publications, government reports and corporate literature Order Information To order fill out the coupon below and mail to The Freedonia Group, or place your order by phone toll free (800) 927-5900 (US) or (440) 684-9600, or by fax (440) 646-0484, or by e-mail at info@freedoniagroup.com Free Handling and Shipping There is NO charge for handling and UPS shipping in the US. Expect delivery in 3 to 5 days. Outside the US, Freedonia provides free airmail service. If you require express delivery, Freedonia provides this to you at cost. Save Fifteen Percent If you order three (3) different titles at the same time, you can receive a discount of 15%. If your order is accompanied by a check, you may take a 5% cash discount (discounts do not apply to corporate use licenses). Credit Card Orders Other Titles from The Freedonia Group World Thermoplastic Elastomers Degradable Plastics Global demand for thermoplastic elastomers (TPEs) will rise 6.3 percent annually through 2015. Gains will be driven by rebounding motor vehicle production in the US and Western Europe. Advances will also be fueled by the rising use of TPEs in the developing countries, where these materials are continuing to penetrate new applications. This study analyzes the 4.1 million metric ton world TPE industry, with forecasts for 2015 and 2020 by market, product, world region and for 15 countries. The study also evaluates company market share and profiles industry players. #2803.............September 2011............... $6400 US demand for degradable plastics is forecast to rise 16.6 percent annually through 2014, driven by interest in environmentally friendly products. Polylactic acid (PLA) and starchbased plastics will remain the dominant types and see strong growth. Polyhydroxyalkanoate (PHA) will be the fastest growing type, from a small base. This study analyzes the 151 million pound US degradable plastic industry, with forecasts for 2014 and 2019 by type, product and market. It also evaluates company market share and profiles industry players. #2648................August 2010.................. $4800 Silicones World Silicones Checks must be paid in US funds, drawn against a US bank and mailed directly to The Freedonia Group. For wire transfer instructions please contact our customer service department at info@freedoniagroup.com. Or you may use a credit card. World demand for silicones will rise 6.2 percent annually through 2015. The Asia/Pacific region will remain the largest and fastest-growing market. Electrical and electronic products will continue to be the leading outlet, bolstered by high-growth applications such as components for LEDs and solar energy products. This study examines the $12.4 billion world market for silicones, with forecasts for 2015 and 2020 by market, product, world region and for 15 countries. The study also evaluates company market share and profiles industry participants. #2779.................. July 2011.................... $5900 Corporate Use License World Emulsion Polymers Now every decision maker in your organization can act on the key intelligence found in all Freedonia studies. For an additional $2,600 you receive unlimited use of an electronic version (PDF) of the study. Place it on your Intranet, e-mail it to coworkers around the world, or print it as many times as you like! Order it today. Global demand for emulsion polymers will rise 5.2 percent annually through 2014, driven by rising demand for latex polymers used in the production of water-based paints, coatings and adhesives. Acrylics will remain the leading emulsion polymer type and grow the fastest. This study analyzes the 9.9 million metric ton world emulsion polymer industry, with forecasts for 2014 and 2019 by market, product, world region and for 14 major countries. It also evaluates company market share and profiles industry players. #2686............... October 2010................. $5700 You may charge your order to either American Express, MasterCard or Visa. Please include your credit card account number, expiration date and your signature. Orders Outside of the US Online Access The complete text and tables from our studies and reports can be purchased at our website www.freedoniagroup.com and through major commercial online hosts. ORDER FORM Click here to purchase online Need analysis on a topic not covered by Freedonia Industry Studies? Call Customer Service for details on Freedonia Custom Research TITLE PRICE World Bioplastics Name: US demand for silicones is forecast to rise 5.3 percent annually through 2014. Consumer goods such as cosmetics and toiletries will remain a fast growing market, as will medical products. Silicone gels will be the fastest growing type, driven by robust growth in demand for gel encapsulants in LED and photovoltaic applications. This study analyzes the $2.8 billion US silicone industry, with forecasts for 2014 and 2019 by product, market and application. It also evaluates company market share and profiles industry players. #2665.................. July 2010.................... $4700 Corporate Use License (add to study price) Title: $6100 + $2600 __ Additional Print Copies @ $600 each Company: Division: Total (including selected options): Street: (no PO Box please) City/State/Zip: Bill my company e-mail: F-WEB-2823 American Express MasterCard Visa month Country: Phone: $ Enclosed is my check (5% discount) drawn on a US bank and payable to The Freedonia Group, Inc., in US funds (Ohio residents add 7.75% sales tax) Fax: Credit Card # year Expiration Date Signature: The Freedonia Group, Inc. 767 Beta Drive Cleveland, OH 44143-2326 USA website: www.freedoniagroup.com phone: 800-927-5900 (US) or 440-684-9600 fax: 440-646-0484 e-mail: info@freedoniagroup.com
