Voter Turnout in Japan and the United States
advertisement
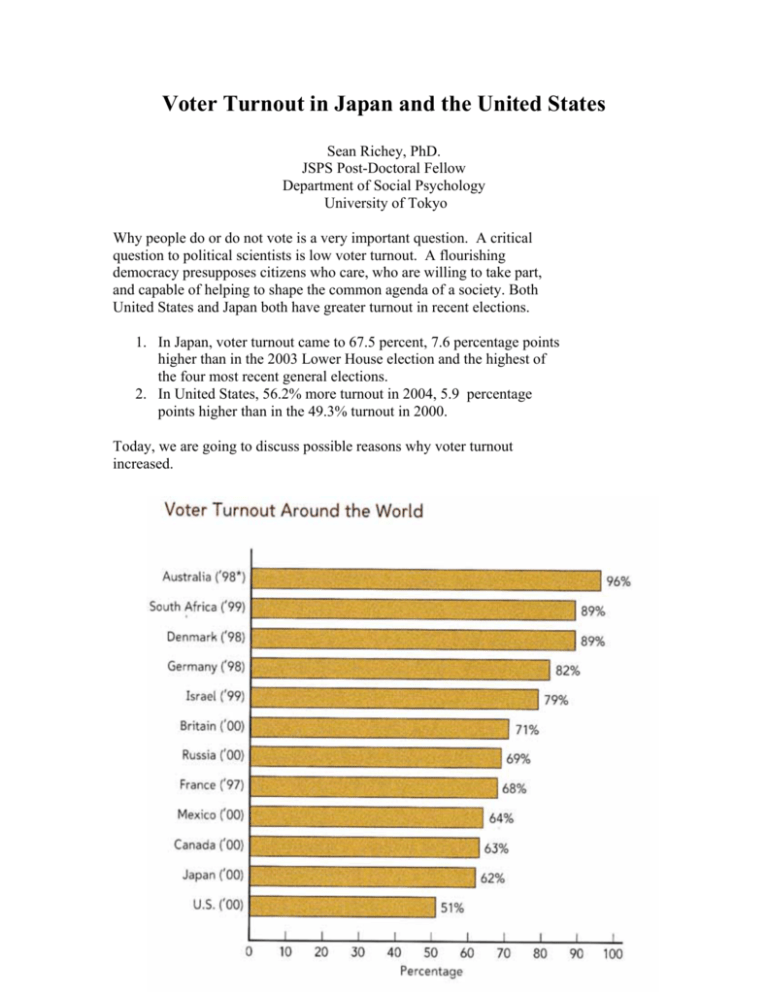
Voter Turnout in Japan and the United States Sean Richey, PhD. JSPS Post-Doctoral Fellow Department of Social Psychology University of Tokyo Why people do or do not vote is a very important question. A critical question to political scientists is low voter turnout. A flourishing democracy presupposes citizens who care, who are willing to take part, and capable of helping to shape the common agenda of a society. Both United States and Japan both have greater turnout in recent elections. 1. In Japan, voter turnout came to 67.5 percent, 7.6 percentage points higher than in the 2003 Lower House election and the highest of the four most recent general elections. 2. In United States, 56.2% more turnout in 2004, 5.9 percentage points higher than in the 49.3% turnout in 2000. Today, we are going to discuss possible reasons why voter turnout increased. Japan Parliamentary Elections Year Total Vote Vote/Reg VAP Pop. Size 1953 34,946,130 74.2% 49,419,000 86,700,000 1955 37,334,338 75.8% 50,730,000 89,000,000 1958 40,042,489 77.0% 54,924,000 91,540,000 1960 39,920,119 73.5% 55,926,000 93,210,000 1963 41,458,946 71.1% 60,416,370 95,899,000 1967 46,599,456 74.0% 63,522,900 100,830,000 1969 47,442,401 68.5% 69,123,900 103,170,000 1972 52,929,059 71.7% 71,663,200 106,960,000 1976 57,231,993 73.4% 77,814,750 112,775,000 1979 54,518,515 68.0% 79,964,100 115,890,000 1980 60,338,439 74.6% 80,771,400 117,060,000 1983 57,240,830 67.9% 84,673,890 119,259,000 1986 61,703,794 64.0% 86,259,320 121,492,000 1990 66,215,906 73.3% 88,348,250 124,434,155 1993 63,574,819 67.0% 95,955,900 124,670,000 1995 43,307,400 44.5% 96,460,210 125,273,000 1996 57,766,696 59.0% 96,672,730 125,549,000 2000 60,882,471 60.6% 103,155,387 126,996,466 2003 61 775 520 59.86 103,200,000 127,417,244 2005 69 805 340 67.51 103,400,000 127,417,244 United States Presidential Elections Year Total Vote VAP Vote/VAP Pop. Size 1964 70,644,592 114,090,000 61.9% 192,119,000 1968 73,211,875 120,328,186 60.8% 200,710,000 1972 77,718,554 140,776,000 55.2% 208,840,000 1976 81,555,889 152,309,190 53.5% 218,035,000 1980 86,515,221 164,597,000 52.6% 227,738,000 1984 92,652,842 174,466,000 53.1% 236,681,000 1988 91,594,809 182,778,000 50.1% 245,057,000 1992 104,600,366 189,529,000 55.2% 255,407,000 1996 92,712,803 196,511,000 47.2% 265,679,000 2000 105,404,546 213,954,023 49.3% 284,970,789 2004 122,300,762 217,767,000 56.2% 293,655,404

