Chapter 2- Problems to look at MULTIPLE CHOICE. Choose the one
advertisement
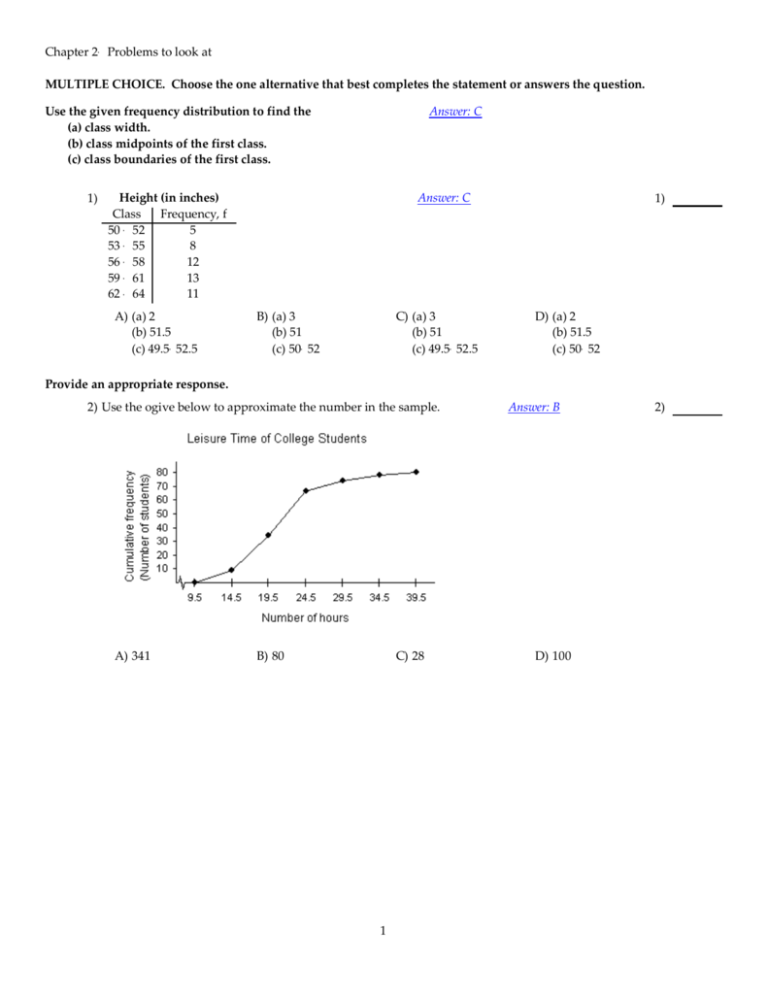
Chapter 2- Problems to look at MULTIPLE CHOICE. Choose the one alternative that best completes the statement or answers the question. Use the given frequency distribution to find the (a) class width. (b) class midpoints of the first class. (c) class boundaries of the first class. 1) Answer: C Height (in inches) Class Frequency, f 50 - 52 5 53 55 8 56 - 58 12 59 - 61 13 62 - 64 11 A) (a) 2 (b) 51.5 (c) 49.5-52.5 1) Answer: C B) (a) 3 (b) 51 (c) 50-52 C) (a) 3 (b) 51 (c) 49.5-52.5 D) (a) 2 (b) 51.5 (c) 50-52 Provide an appropriate response. 2) Use the ogive below to approximate the number in the sample. A) 341 B) 80 C) 28 1 Answer: B D) 100 2) SHORT ANSWER. Write the word or phrase that best completes each statement or answers the question. The highway patrol, using radar checked the speeds (in mph) of 30 passing motorist at a checkpoint. The results are listed below. 44 35 50 38 41 40 37 41 47 50 36 41 43 36 35 36 50 40 43 45 42 42 45 43 49 48 39 38 48 33 3) Construct a frequency table using five classes. Include the following columns: class limits, class boundaries, Frequency, Relative Frequency,class midpoints and Cumulative Frequency of the classes. Class Limits 33-35 36-38 39-41 42-44 45-47 48-50 Class boundaries 32.5-35.5 35.5-38.5 38.5-41.5 41.5-44.5 44.5-47.5 47.5-50.5 Frequency 3 6 6 6 3 6 Class Midpoints 34 37 40 41 46 49 Relitive Freq. 0.10 0.20 0.20 0.20 0.10 0.20 3) Cummulative Freq. 3 9 15 21 24 30 MULTIPLE CHOICE. Choose the one alternative that best completes the statement or answers the question. Provide an appropriate response. Answer: C 4) For the stem-and-leaf plot below, what is the maximum and what is the minimum entry? Key : 11 7 = 11.7 11 12 13 14 15 16 17 6 4 0 3 0 2 0 7 6 1 4 1 2 3 6 1 6 1 5 7 2 6 2 7 8 3 8 3 8 9 6 9 7 8 6 9 7 9 7 8 8 9 8 9 9 A) max: 173; min: 116 B) max: 17.0; min: 11.6 C) max: 17.3; min: 11.6 D) max: 17.3; min: 11.7 2 4) Provide an appropriate response. Answer: D 5) For the dot plot below, what is the maximum and what is the minimum entry? A) max: 54; min: 12 B) max: 14; min: 12 C) max: 54; min: 15 D) max: 17; min: 12 5) SHORT ANSWER. Write the word or phrase that best completes each statement or answers the question. Provide an appropriate response. 6) A study was conducted to determine how certain families pay on their credit card balances. Two hundred families with a household annual income between $25,000 and $49,999 were randomly selected and the results are listed below. Construct a pie chart or circle chart of the data. Payment schedule Almost always pay off balance Sometimes pay off balance Hardly ever pay off balance Payment type Almost Sometimes Hardly Frequency 97 41 62 6) Frequency 97 41 62 Relative Freq 0.485 0.205 0.31 Central Angle 174.6 73.6 111.6 Then draw graph MULTIPLE CHOICE. Choose the one alternative that best completes the statement or answers the question. For the given data , construct a frequency distribution and frequency histogram of the data using five classes. Describe the shape of the histogram as symmetric, uniform, skewed left, or skewed right. Answer: C 7) Data set: California Pick Three Lottery 7) 3 6 7 6 0 6 1 7 8 4 1 5 7 5 9 1 5 3 9 9 2 2 3 0 8 8 4 0 2 4 A) skewed left B) skewed right C) uniform 3 D) symmetric 8) Data set: California Pick Three Lottery 8) Answer: D 8 6 7 6 0 9 1 7 8 4 1 5 7 5 9 7 5 3 9 9 8 8 3 9 8 8 9 0 2 7 A) symmetric B) uniform C) skewed right Provide an appropriate response. D) skewed left Answer: A 9) Use the histogram below to approximate the mode heart rate of adults in the gym. A) 70 B) 2 C) 55 9) D) 42 Provide an appropriate response. 10) The lengths of phone calls from one household (in minutes) were 2, 4, 6, 7, and 8 minutes. Find the midrange for this data. Answer: D A) 2 minutes B) 10 minutes C) 6 minutes D) 5 minutes SHORT ANSWER. Write the word or phrase that best completes each statement or answers the question. 11) Find the mean, median, and mode of the following numbers: 73 76 69 73 66 74 73 67 68 71 Mean: Xbar = 71 Median: M =Q2 = 72 Mode: 73 4 11) 10) MULTIPLE CHOICE. Choose the one alternative that best completes the statement or answers the question. 12) A student receives test scores of 62, 83, and 91. The student's final exam score is 88 and homework score is 76. Each test is worth 20% of the final grade, the final exam is 25% of the final grade, and the homework grade is 15% of the final grade. What is the student's mean score (Weighted Average) in the class? Answer: C A) 85.6 B) 76.6 13) Find the sample standard deviation. 2 6 15 9 11 22 1 A) 7.1 C) 80.6 12) D) 90.6 13) Answer: A 4 8 19 B) 2.1 C) 6.3 D) 6.8 SHORT ANSWER. Write the word or phrase that best completes each statement or answers the question. 14) The heights (in inches) of all 10 adult males in an office are listed below. Find the population standard deviation and the population variance. 14) 70 72 71 70 69 73 69 68 70 71 Population Standard Deviation: Population Variance: 2= = 1.42 (1.477)2 = 2.01 15) In a random sample, 10 students were asked to compute the distance they travel one way to school to the nearest tenth of a mile. The data is listed below. Compute the coefficient of variation. 15) 1.1 5.2 3.6 5.0 4.8 1.8 2.2 5.2 1.5 0.8 Coefficient of Variation = C.V. = (1.82/3.12)*100% = 58.3% MULTIPLE CHOICE. Choose the one alternative that best completes the statement or answers the question. 16) The test scores of 30 students are listed below. Find the five-number summary. 31 41 45 48 52 55 56 58 63 65 67 67 69 70 70 74 75 78 79 79 80 81 83 85 85 87 90 92 95 99 A) Min = 31, Q1 = 58, Q2 = 72, Q3 = 83, Max = 99 B) Min = 31, Q1 = 58, Q2 = 70, Q3 = 83, Max = 99 C) Min = 31, Q1 = 57, Q2 = 70, Q3 = 81, Max = 99 D) Min = 31, Q1 = 57, Q2 = 72, Q3 = 81, Max = 99 5 Answer: A 16) 17) For the stem-and-leaf plot below, find the range of the data set. 17) Answer: B Key: 2 7 = 27 1 2 2 3 3 4 3 6 7 0 6 0 5 6 7 1 6 1 A) 13 6 7 1 6 7 8 2 7 8 8 3 8 9 9 9 9 4 4 5 8 9 B) 28 C) 34 D) 41 SHORT ANSWER. Write the word or phrase that best completes each statement or answers the question. 18) What is the difference between using µ and x to represent a mean? 18) µ represents a population mean and x represents a sample mean 19) Why do data entries need to be ordered before the median can be found? 19) The median is found by calculating the mean of the two middle data entries. The middle entries cannot be found unless the data entries are first ordered. MULTIPLE CHOICE. Choose the one alternative that best completes the statement or answers the question. 20) The heights (in inches) of 10 adult males are listed below. Find the sample standard deviation of the data set. Answer: C 70 72 71 70 69 73 69 68 70 71 A) 3 B) 2.38 C) 1.49 D) 70 SHORT ANSWER. Write the word or phrase that best completes each statement or answers the question. 21) The weights (in pounds) of 30 preschool children are listed below. Find the interquartile range of the 30 weights listed below. What can you conclude from the result? 25 25 26 26.5 27 27 27.5 28 28 28.5 29 29 30 30 30.5 31 31 32 32.5 32.5 33 33 34 34.5 35 35 37 37 38 38 Q 1 =28 Q 3 =34 IQR = Q3 -Q1 = 34-28 = 6. This means that the weights of the middle half of the data set vary by 6 pounds. 6 21) 20) 22) The test scores of 30 students are listed below. Draw a box-and-whisker plot that represents the data. 22) 31 41 45 48 52 55 56 56 63 65 67 67 69 70 70 74 75 78 79 79 80 81 83 85 85 87 90 92 95 99 31 56 72 83 99 MULTIPLE CHOICE. Choose the one alternative that best completes the statement or answers the question. 23) Use the box-and-whisker plot below to determine which statement is accurate. A) About 25% of the adults have cholesterol levels of at most 211. B) About 75% of the adults have cholesterol levels less than 180. C) One half of the cholesterol levels are between 180 and 197.5. D) One half of the cholesterol levels are between 180 and 211. 7 Answer: D 23)
