STAT 4020 Multivariate Analysis
advertisement
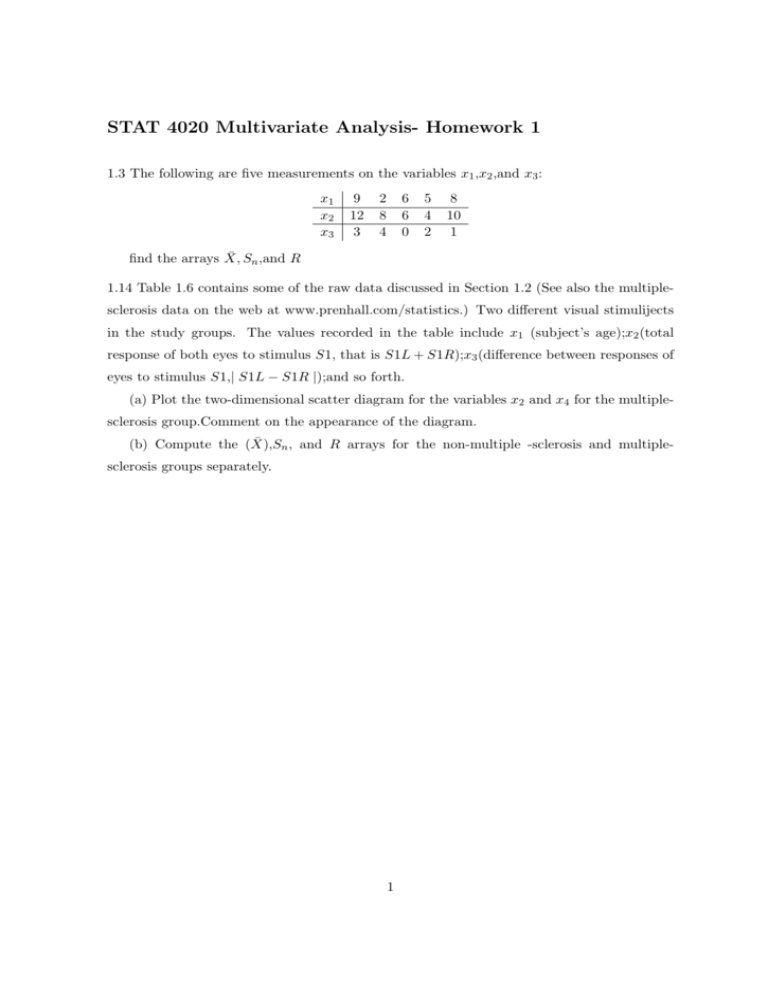
STAT 4020 Multivariate Analysis- Homework 1 1.3 The following are five measurements on the variables x1 ,x2 ,and x3 : x1 x2 x3 9 12 3 2 8 4 6 6 0 5 4 2 8 10 1 find the arrays X̄, Sn ,and R 1.14 Table 1.6 contains some of the raw data discussed in Section 1.2 (See also the multiplesclerosis data on the web at www.prenhall.com/statistics.) Two different visual stimulijects in the study groups. The values recorded in the table include x1 (subject’s age);x2 (total response of both eyes to stimulus S1, that is S1L + S1R);x3 (difference between responses of eyes to stimulus S1,| S1L − S1R |);and so forth. (a) Plot the two-dimensional scatter diagram for the variables x2 and x4 for the multiplesclerosis group.Comment on the appearance of the diagram. (b) Compute the (X̄),Sn , and R arrays for the non-multiple -sclerosis and multiplesclerosis groups separately. 1
