The Art of Profitability
advertisement
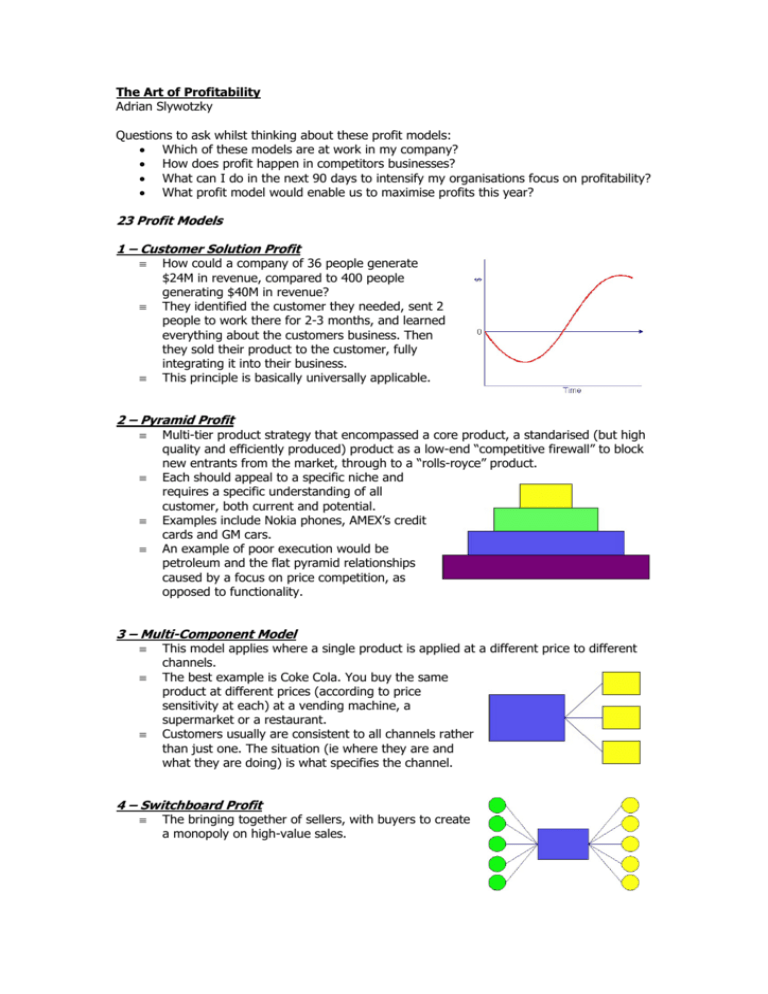
The Art of Profitability Adrian Slywotzky Questions to ask whilst thinking about these profit models: • Which of these models are at work in my company? • How does profit happen in competitors businesses? • What can I do in the next 90 days to intensify my organisations focus on profitability? • What profit model would enable us to maximise profits this year? 23 Profit Models 1 – Customer Solution Profit ≡ ≡ ≡ How could a company of 36 people generate $24M in revenue, compared to 400 people generating $40M in revenue? They identified the customer they needed, sent 2 people to work there for 2-3 months, and learned everything about the customers business. Then they sold their product to the customer, fully integrating it into their business. This principle is basically universally applicable. 2 – Pyramid Profit ≡ ≡ ≡ ≡ Multi-tier product strategy that encompassed a core product, a standarised (but high quality and efficiently produced) product as a low-end “competitive firewall” to block new entrants from the market, through to a “rolls-royce” product. Each should appeal to a specific niche and requires a specific understanding of all customer, both current and potential. Examples include Nokia phones, AMEX’s credit cards and GM cars. An example of poor execution would be petroleum and the flat pyramid relationships caused by a focus on price competition, as opposed to functionality. 3 – Multi-Component Model ≡ ≡ ≡ This model applies where a single product is applied at a different price to different channels. The best example is Coke Cola. You buy the same product at different prices (according to price sensitivity at each) at a vending machine, a supermarket or a restaurant. Customers usually are consistent to all channels rather than just one. The situation (ie where they are and what they are doing) is what specifies the channel. 4 – Switchboard Profit ≡ The bringing together of sellers, with buyers to create a monopoly on high-value sales. 5 – Time Profit ≡ ≡ Upfront innovation yielding large profits that are eroded over time by competitors entering the market created. The key to building large profits is to master the art of innovation so efficiently, that you maximise the profits upfront. 6 – Blockbuster Profit ≡ ≡ Applicable to managing a product pipeline. Differentiation of high-profit R&D vs anti-profit RD i.e. a market where customers won’t pay for what you develop. 7 – Profit Multiplier Model ≡ ≡ ≡ ≡ The use of a multiplier effect to more than merely double profits. A good example is Honda’s manufacturing car engines, outboard motors, industrial engines and more. Basically using a base skill of motor engineering to create products across different markets. Forms of realisation include skills, assets and Intellectual Property. Different products that realise a Blockbuster Business Operating Model to increase the odds of success. 8 – Entrepreneurial Profit ≡ Fundamental tenants: copy your competitors, celebrate star performers, save money, experiment, cut loses quickly, focus on wins and have fun. 9 – Specialist Profit ≡ ≡ ≡ ≡ ≡ Really learning vs just learning a topic. EDS did not learn everything at once. It chose a segment and learned it exquisitely well. They learned all the processes of an industry so well, not just in general, but specifically for each player. This can lead to a reputation for experience, leading to higher utilisation of resources, and high sales volumes and margins per sale. Additionally, this model can attract better talent to a business, shorter sales cycles, higher quality outputs and a better ability to up-sell to customers. Most of the cost is in developing the solution. 10 – Install Base Profit ≡ ≡ ≡ ≡ ≡ Demand volatility: high vs low Price sensitivity: high vs low Per unit cost: high vs low Consumer control: high vs low Sellers can screw this up buy having too high a price on consumables, or marking it too hard for the customer to buy. 11 – De Facto Standard ≡ ≡ Surprises cost money, therefore De Facto Standard allows for plan-ability for customers. IBM Mainframes, Microsoft Windows, Oracle DB…. 12 – Brand Profit ≡ ≡ ≡ ≡ A cumulative effect of ad spending. We spend what we can afford rather than spending to drive market share. This shouldn’t preclude finding more leveraged methods i.e. differentiation, better channels or Share Determining Segments (SDS). SDS is where high share today translates to high share of the whole market tomorrow. An example is architects. 13 – Specialty Product Profit ≡ ≡ Specialist products earn higher gross margins. This shift for specialist to commodity is something every business needs to do at some point. 14 – Local Leadership Profit ≡ ≡ ≡ Generates higher buying power, better traffic, lower recruiting costs, high impact – low cost marketing whilst allowing for premium pricing. The effect is regional business fuelling growth to neighbouring regions. This approach requires a consistent and persistent approach. Starbucks Walmart 15 – Transaction Scale Profit ≡ ≡ Big transactions mean bigger profits. Big transactions = relationships. 16 – Value Chain Profit ≡ ≡ ≡ Some locations in the value chain are more important than others (e.g. Microsoft and Intel) The key is identifying the control point and owing it. Points change and emerge across industries. 17 – Cycle Profit ≡ ≡ This focuses on volume and not the relationship between cycles and profit. The goal is to reduce the costs of production so you are ahead of the industry in break even and profits. 18 – After Sale Profit ≡ ≡ ≡ ≡ Price sensitivity is highest when ticket price is high, variability is high and there are lots of options. The converse is also true. This can create an environment for follow up opportunities. Different to install base – in this case, the manufacturer doesn’t benefit from the “follow up” market. It takes a different sort of organisation to focus on sales after the big ticket sale. 19 – New Product Profit ≡ ≡ ≡ Not to be confused with Time or Specialty Product profit models. Over invest on the upside and cut back investment on the downside. Measure everything that will give you an indication that you are approaching the peak i.e. growth rates, price changes, etc. 20 – Relative Market Share Profit ≡ ≡ ≡ ≡ Characterised by Jack Welch It works via scale in manufacturing combined with the lowest purchasing prices. This results in the lowest cost per unit, with the lowest R&D cost per unit. In addition, this brings other benefits in that RMS becomes a magnet for talent and also combines multipliers such as Value Chain Profit and De Facto Standard profit models. 21 – Experience Curve Profit ≡ ≡ ≡ ≡ Was 60% of a 1960’s Business School curriculum – now about 1%. Similar to RMS but focuses purely on taking costs out of the system. Experience curve is also about learning rates i.e. knowing when to cut costs, what to focus on. The danger here is completely managing details and losing vision for where the product lifecycle is going i.e. new paradigm (cans to bottles) or a new system (DELL, Southwest). 22 – Low-Cost Business Design Profit ≡ Focusing on inflicting value chaos to experience curve or RMS models by undercutting on price (by taking 20-30% of the costs out of the system) or the next system (i.e. cans to pet bottles). 23 – Digital Profit ≡ ≡ ≡ ≡ Shifting from conventional to digital can have a huge impact on profitability A great example is DELL. Others include: CEMEX, Oracle. All delivering more than 10x more profitable models. Delivers higher customer control to select (Choice Boards) But it can’t redeem a crummy business model !!!
