Corning® HepatoCells: An In Vitro Screening Tool for Predicting
Clinical CYP3A4 Induction
1Rongjun
Zuo, 1Feng Li, 1Sweta Parikh, 1Mercyanne Andes, 1Kirsten Cooper, 2Enne Akor, 2George Zhang, 3Jin Liu, 3Ronald A.
Faris, 4Charles L. Crespi, and 1Christopher J. Patten
1Two
Oak Park, Corning Incorporated, Life Sciences, Bedford, MA 01730 USA
26 Henshaw Street, Corning Incorporated, Life Sciences , Woburn, MA 01801 USA
31 Science Center Drive, Corning Incorporated, Life Sciences, Corning, NY 14831 USA
4836 North Street Building 300 Suite 3401, Corning Incorporated, Life Sciences, Tewksbury, MA 01876 USA
C
3A. RIS calibration
D
5
6
4
E
F
2
1
10
100
3
2
1
1
10
100
0.1
1000
1
Data analysis. EC50 and Emax were determined from concentration‐dependent
induction response curves by fitting the curves to a sigmoidal 3 parameter
function of SigmaPlot™ (Systat Software Inc.). RIS and R3 were calculated using
unbound Cmax from the literature1,3 and equations described below: RIS = (Emax x
Cmax,ub)/(EC50 + Cmax,ub), R3 = 1/(1 + d x Emax x Cmax,ub/(EC50 + Cmax,ub)) with d = 1.
A calibration curve was generated by plotting the induction paramter (e.g., RIS)
against observed midazolam AUC change using the Hill 3 parameter function of
SigmaPlot. Prediction accuracy using HepatoCells was evaluated by assesing the
correlation between predicted AUC change with observed AUC change, and was
compared with that of primary human hepatocytes.
Conclusions
• Corning HepatoCells showed concentration‐dependent responses to a group
of known clinical CYP3A4 inducers with very good correlation (R2>0.9).
• All 3 lots of HepatoCells behaved similarly to primary human hepatocytes in
terms of estimation of induction parameter (i.e., RIS), with much smaller lot‐
to‐lot variations.
• Predicted DDI (AUC change) estimated using RIS data generated with in vitro
data from HepatoCells correlated very well (R2>0.9) with clinical clearance
data of CYP3A4 substrates.
• HepatoCells can be used as a potential in vitro screening tool for prediction
of clinical CYP3A4 induction.
100
80
60
40
20
0
10
100
0.01
0.1
1
120
100
80
R2 = 0.94
60
40
20
0
0.1
10
1
R3
RIS
Carbamazepine, M
Phenobarbitol, M
Rifampicin, M
3C. Cmax/EC50 calibration
120
% Decrease in Observed Midazolam AUC
6
10
8
6
4
2
Fold (enzymatic activity)
Fold (enzymatic activity)
10
5
4
3
2
1
1
10
100
0.1
1000
8
6
4
2
1
Phenobarbitol, M
10
0.1
100
1
10
18
10
B
6
4
2
F o ld (e n z y m a tic a c tiv ity )
F o ld (e n z y m a tic a c tiv ity )
2
R = 0.987
C
16
8
8
R2 = 0.996
6
4
2
14
2
R = 0.985
12
10
8
6
4
2
0
0
1
10
100
0
1000
1
Phenytoin, M
10
100
60
40
20
0
0.01
0.1
1
10
Cmax/EC50
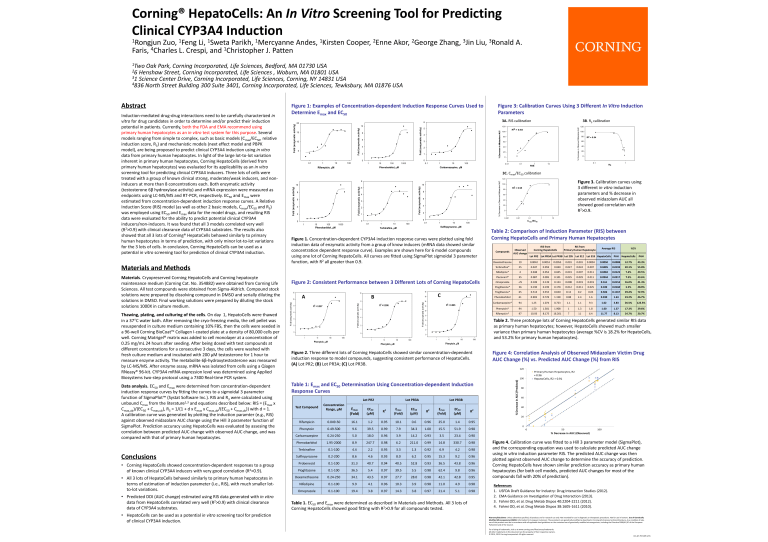
Figure 2: Consistent Performance between 3 Different Lots of Corning HepatoCells
A
R2 = 0.95
100
Figure 1. Concentration‐dependent CYP3A4 induction response curves were plotted using fold
induction data of enzymatic activity from a group of know inducers (mRNA data showed similar
concentration dependent response curve). Examples are shown here for 6 model compounds
using one lot of Corning HepatoCells. All curves are fitted using SigmaPlot sigmoidal 3 parameter
function, with R2 all greater than 0.9.
10
80
Sulfinpyrazone, M
Terbinafine, M
12
Figure 3. Calibration curves using
3 different in vitro induction
parameters and % decrease in
observed midazolam AUC all
showed good correlation with
R2>0.9.
100
0.001
0
0
0
F o ld (e n z y m a tic a c tiv ity )
Thawing, plating, and culturing of the cells. On day 1, HepatoCells were thawed
in a 37C water bath. After removing the cryo‐freezing media, the cell pellet was
resuspended in culture medium containing 10% FBS, then the cells were seeded in
a 96‐well Corning BioCoat™ Collagen I‐coated plate at a density of 80,000 cells per
well. Corning Matrigel® matrix was added to cell monolayer at a concentration of
0.25 mg/mL 24 hours after seeding. After being dosed with test compounds at
different concentrations for a consecutive 3 days, the cells were washed with
fresh culture medium and incubated with 200 µM testosterone for 1 hour to
measure enzyme activity. The metabolite 6β‐hydroxytestosterone was measured
by LC‐MS/MS. After enzyme assay, mRNA was isolated from cells using a Qiagen
RNeasy® 96‐kit. CYP3A4 mRNA expression level was determined using Applied
Biosystems two‐step protocol using a 7300 Real‐time PCR system.
R2 = 0.93
0
0
0.1
4
% Decrease in Observed Midazolam AUC
10
8
3B. R3 calibration
120
5
% Decrease in Midazolam AUC
15
Fold (enzymatic activity)
10
Materials and Methods
Materials. Cryopreserved Corning HepatoCells and Corning hepatocyte
maintenance medium (Corning Cat. No. 354882) were obtained from Corning Life
Sciences. All test compounds were obtained from Sigma‐Aldrich. Compound stock
solutions were prepared by dissolving compound in DMSO and serially diluting the
solutions in DMSO. Final working solutions were prepared by diluting the stock
solutions 1000X in culture medium.
Figure 3: Calibration Curves Using 3 Different In Vitro Induction
Parameters
6
20
Fold (enzymatic activity)
Fold (enzymatic activity)
Induction‐mediated drug‐drug interactions need to be carefully characterized in
vitro for drug candidates in order to determine and/or predict their induction
potential in patients. Currently, both the FDA and EMA recommend using
primary human hepatocytes as an in vitro test system for this purpose. Several
models ranging from simple to complex, such as basic models (Cmax/EC50, relative
induction score, R3) and mechanistic models (next effect model and PBPK
model), are being proposed to predict clinical CYP3A4 induction using in vitro
data from primary human hepatocytes. In light of the large lot‐to‐lot variation
inherent in primary human hepatocytes, Corning HepatoCells (derived from
primary human hepatocytes) was evaluated for its applicability as an in vitro
screening tool for predicting clinical CYP3A4 inducers. Three lots of cells were
treated with a group of known clinical strong, moderate/weak inducers, and non‐
inducers at more than 8 concentrations each. Both enzymatic activity
(testosterone 6β hydroxylase activity) and mRNA expression were measured as
endpoints using LC‐MS/MS and RT‐PCR, respectively. EC50 and Emax were
estimated from concentration‐dependent induction response curves. A Relative
Induction Score (RIS) model (as well as other 2 basic models, Cmax/EC50 and R3)
was employed using EC50 and Emax data for the model drugs, and resulting RIS
data were evaluated for the ability to predict potential clinical CYP3A4
inducers/non‐inducers. It was found that all 3 models correlated very well
(R2>0.9) with clinical clearance data of CYP3A4 substrates. The results also
showed that all 3 lots of Corning® HepatoCells behaved similarly to primary
human hepatocytes in terms of prediction, with only minor lot‐to‐lot variations
for the 3 lots of cells. In conclusion, Corning HepatoCells can be used as a
potential in vitro screening tool for prediction of clinical CYP3A4 induction.
Figure 1: Examples of Concentration‐dependent Induction Response Curves Used to
Determine Emax and EC50
Fold (enzymatic activity)
Abstract
1
1000
10
100
1000
Table 2: Comparison of Induction Parameter (RIS) between
Corning HepatoCells and Primary Human Hepatocytes
Compounds
Observed
AUC change
RIS from
Corning HepatoCells
RIS from
Primary Human Hepatocyte
Average RIS
Lot PR2 Lot PR3A Lot PR3B Lot 295 Lot 312 Lot 318 HepatoCells
%CV
PHH
HepatoCells
PHH
Dexamethasone
19
0.0042
0.0053
0.0053
0.001
0.001
0.0004
0.0050
0.0008
12.7%
43.3%
Terbinafine*
25
0.047
0.059
0.040
0.027
0.024
0.007
0.0485
0.0193
20.1%
55.8%
Nifedipine*
4
0.048
0.052
0.045
0.019
0.007
0.011
0.0484
0.0123
7.4%
49.5%
Pleconaril*
35
0.087
0.095
0.101
0.025
0.029
0.011
0.0944
0.0217
7.5%
43.6%
Omeprazole
‐25
0.189
0.139
0.154
0.008
0.019
0.019
0.161
0.0153
16.0%
41.4%
Pioglitazone*
26
0.190
0.199
0.178
0.012
0.011
0.025
0.189
0.0160
5.5%
48.8%
Troglitazone*
65
0.513
0.355
0.650
0.12
0.2
0.03
0.506
0.1167
29.2%
72.9%
Phenobarbitol
61
0.902
0.729
1.158
0.88
2.4
1.6
0.930
1.63
23.2%
46.7%
Carbamazepine*
94
1.25
1.074
0.723
1.1
1.1
9.3
1.02
3.83
26.5%
123.5%
Phenytoin*
94
1.50
1.381
1.908
1
1.3
1.8
1.60
1.37
17.3%
29.6%
Rifampicin*
97
10.93
8.175
16.201
7
11
6.4
11.77
8.13
34.7%
30.7%
Table 2. Three prototype lots of Corning HepatoCells generated similar RIS data
as primary human hepatocytes; however, HepatoCells showed much smaller
variance than primary human hepatocytes (average %CV is 18.2% for HepatoCells,
and 53.2% for primary human hepatocytes).
Phenytoin, M
Phenytoin, M
Figure 2. Three different lots of Corning HepatoCells showed similar concentration‐dependent
induction response to model compounds, suggesting consistent performance of HepatoCells.
(A) Lot PR2; (B) Lot PR3A; (C) Lot PR3B.
Figure 4: Correlation Analysis of Observed Midazolam Victim Drug
AUC Change (%) vs. Predicted AUC Change (%) from RIS
Table 1: Emax and EC50 Determination Using Concentration‐dependent Induction
Response Curves
Lot PR2
Test Compound
Concentration
Range, µM
Rifampicin
Lot PR3A
Lot PR3B
Emax
(Fold)
EC50
(µM)
R2
Emax
(Fold)
EC50
(µM)
R2
Emax
(Fold)
EC50
(µM)
R2
0.049‐50
16.1
1.2
0.95
10.1
0.6
0.96
25.0
1.4
0.95
Phenytoin
0.49‐500
9.6
39.5
0.99
7.9
34.3
1.00
15.5
51.9
0.98
Carbamazepine
0.24‐250
5.0
18.0
0.96
3.9
14.2
0.93
3.5
23.4
0.90
Phenobarbitol
1.95‐2000
8.9
247.7
0.98
6.2
211.0
0.99
14.8
330.7
0.98
Terbinafine
0.1‐100
4.4
2.2
0.95
3.3
1.3
0.92
6.9
4.2
0.98
Sulfinpyrazone
0.2‐200
8.6
4.6
0.93
8.0
6.2
0.95
15.3
9.2
0.96
Probenecid
0.1‐100
31.3
40.7
0.94
40.5
52.8
0.93
36.5
43.8
0.96
Pioglitazone
0.1‐100
36.5
5.4
0.97
39.5
5.5
0.98
62.4
9.8
0.96
Dexamethasone
0.24‐250
34.1
43.5
0.97
27.7
28.0
0.98
42.1
42.8
0.95
Nifedipine
0.1‐100
9.9
4.1
0.96
10.3
3.9
0.98
11.0
4.9
0.98
Omeprazole
0.1‐100
19.4
3.8
0.97
14.3
3.8
0.97
21.4
5.1
0.98
Table 1. EC50 and Emax were determined as described in Materials and Methods. All 3 lots of
Corning HepatoCells showed good fitting with R2>0.9 for all compounds tested.
Figure 4. Calibration curve was fitted to a Hill 3 parameter model (SigmaPlot),
and the corresponding equation was used to calculate predicted AUC change
using in vitro induction parameter RIS. The predicted AUC change was then
plotted against observed AUC change to determine the accuracy of prediction.
Corning HepatoCells have shown similar prediction accuracy as primary human
hepatocytes (for both cell models, predicted AUC changes for most of the
compounds fall with 20% of prediction).
References
1. USFDA Draft Guidance for Industry: Drug Interaction Studies (2012).
2. EMA Guidance on Investigation of Drug Interaction (2013).
3. Fahmi OD, et al. Drug Metab Dispos 40:2204‐2211 (2012).
4. Fahmi OD, et al. Drug Metab Dispos 38:1605‐1611 (2010).
Warranty/Disclaimer: Unless otherwise specified, all products are for research use only. Not intended for use in diagnostic or therapeutic procedures. Not for use in humans. Use of Genetically
Modified Microorganisms (GMM): Information for European Customers: These products are genetically modified as described in Corning Life Sciences technical literature. As a condition of sale,
use of this product must be in accordance with all applicable local guidelines on the contained use of genetically modified microorganisms, including the Directive 2009/41/EC of the European
Parliament and of the Council.
For a listing of trademarks, visit us at www.corning.com/lifesciences/trademarks.
All other trademarks in this document are the property of their respective owners.
© 2014, 2015 Corning Incorporated. All rights reserved.
CLS‐GT‐PST‐005 5/15

