Introduction to Statistics
advertisement
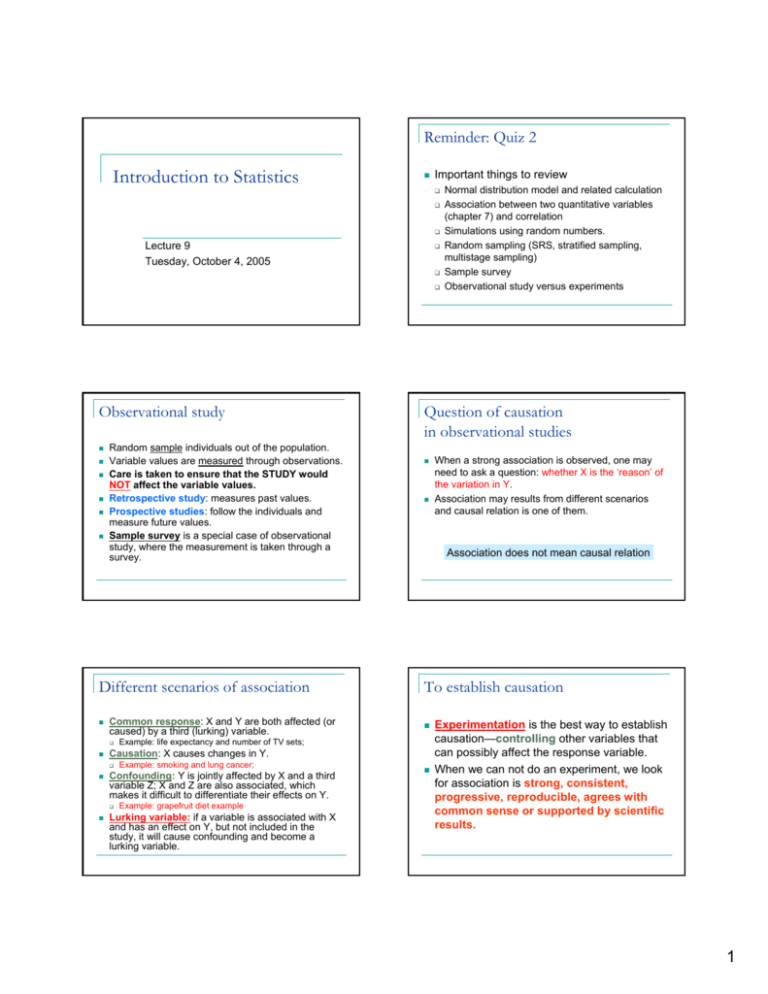
Reminder: Quiz 2 Introduction to Statistics Important things to review Lecture 9 Tuesday, October 4, 2005 Observational study Random sample individuals out of the population. Variable values are measured through observations. Care is taken to ensure that the STUDY would NOT affect the variable values. Retrospective study: measures past values. Prospective studies: follow the individuals and measure future values. Sample survey is a special case of observational study, where the measurement is taken through a survey. Different scenarios of association Common response: X and Y are both affected (or caused) by a third (lurking) variable. Example: smoking and lung cancer; Example: grapefruit diet example Lurking variable: if a variable is associated with X and has an effect on Y, but not included in the study, it will cause confounding and become a lurking variable. When a strong association is observed, one may need to ask a question: whether X is the ‘reason’ of the variation in Y. Association may results from different scenarios and causal relation is one of them. Association does not mean causal relation To establish causation Example: life expectancy and number of TV sets; Confounding: Y is jointly affected by X and a third variable Z; X and Z are also associated, which makes it difficult to differentiate their effects on Y. Question of causation in observational studies Causation: X causes changes in Y. Normal distribution model and related calculation Association between two quantitative variables (chapter 7) and correlation Simulations using random numbers. Random sampling (SRS, stratified sampling, multistage sampling) Sample survey Observational study versus experiments Experimentation is the best way to establish causation—controlling other variables that can possibly affect the response variable. When we can not do an experiment, we look for association is strong, consistent, progressive, reproducible, agrees with common sense or supported by scientific results. 1 Introduction to experimentation Terms Individuals: experimental units (subjects for human experimental units) Treatments: different experiment conditions that are applied to experimental units, which may be controlled by different variables (factors). Specific values of factors that decide a treatment condition are usually referred as levels of the factors Control Control against effects from factors other than the experimental treatments. Control against placebo effects: “The placebo effect is a well-documented medical phenomenon. Often, a patient taking pills will feel better, regardless of what the pills contain, simply because they believe the pills will work. Doctors studying the placebo effect have noticed that large pills work better than small pills and that coloured pills work better than white ones” (BBC Horizon) Thus, in a lot of studies, the group of individuals that receive the placebo is called the control group. Placebo control group can take a lot of forms. Logic behind Randomization In a controlled experiment: different treatment groups have two sources of differences Treatment differences Differences due to random group assignment (by chance) If differences are observed in the responses (experiment outcomes) Principles of Experimentation A good experiment in statistical terms Control: the effects of lurking variables Randomization: the experiments are governed by the laws of probability Replication: reduce variation caused by chance. Randomization Problem with non-randomized treatment groups— unbalanced grouping of experimental units. Example: study on medicine for chronic human disorders Matching: researcher can match similar individuals and assign them to different treatments so that the treatment groups are similar in nature. Issue: expensive, tedious, may not be adequate Randomization: produces groups only differ by chance. Statistical significance Some results are called statistically significant (or of statistical significance) if they are unlikely to be observed by chance: e.g. Shaquille O’neal’s free throws: making 10 out 10 in one game? (Background: his career FT% is 0.533). NOTE THAT this is not an experiment. Can it be due to the random differences between the treatment groups? If unlikely, must be due to the treatment differences between the groups 2 Special designs Cautions about experiment Complete random design: subjects are assigned to treatment groups completely random. Matched pair design: hand cream example Block design: more similar groups Example: antidepressant medicine trials Blocks: patients that are mildly depressed patients that are severely depressed Matched pair is a special case of block design. Before-and-After design and “self” control. Regression line is the mathematical model for a linear relation between X and Y A regression line is of the form: Y=a+bX ‘a’ and ‘b’ are regression coefficients, while ‘a’ is called the intercept, ‘b’ is referred as the slope It is an estimation of the real relation and can be used to give prediction on Y using given X values. Regression analysis is to find values of ‘a’ and ‘b’ for a set of data under study Lack of realism. Example: antidepressant medicine, patients need to meet psychiatrists regularly and usually need to keep diaries. Regression (linear) model: Y=a+bX At a given value X, the prediction given by the regression line is: Yˆ = a + bX For an observed value Y of the response variable at this value X, the prediction error Y − Yˆ measures how the model differs from the reality (presented in the data). Reading A data set on X and Y contains n pairs of real observed values ( X i , Yi ) (as shown in a scatterplot). For any “candidate” line (model), one can evaluate the difference between the model and data using ∑ (Y − a − bX ) i Blind to patients: to reduce psychological reaction to the treatments received Blind to examiners: to avoid unbalanced ‘attention’ to specific treatment group Double blindness is not always possible. Example: new teaching tools Least-square (errors) method L-S method (cont’d) Double blindness Regression analysis Chapter 13 Chapter 7 (review) Chapter 8 2 i i 3
