Redox titration of haem a in cyanide-liganded cytochrome
advertisement
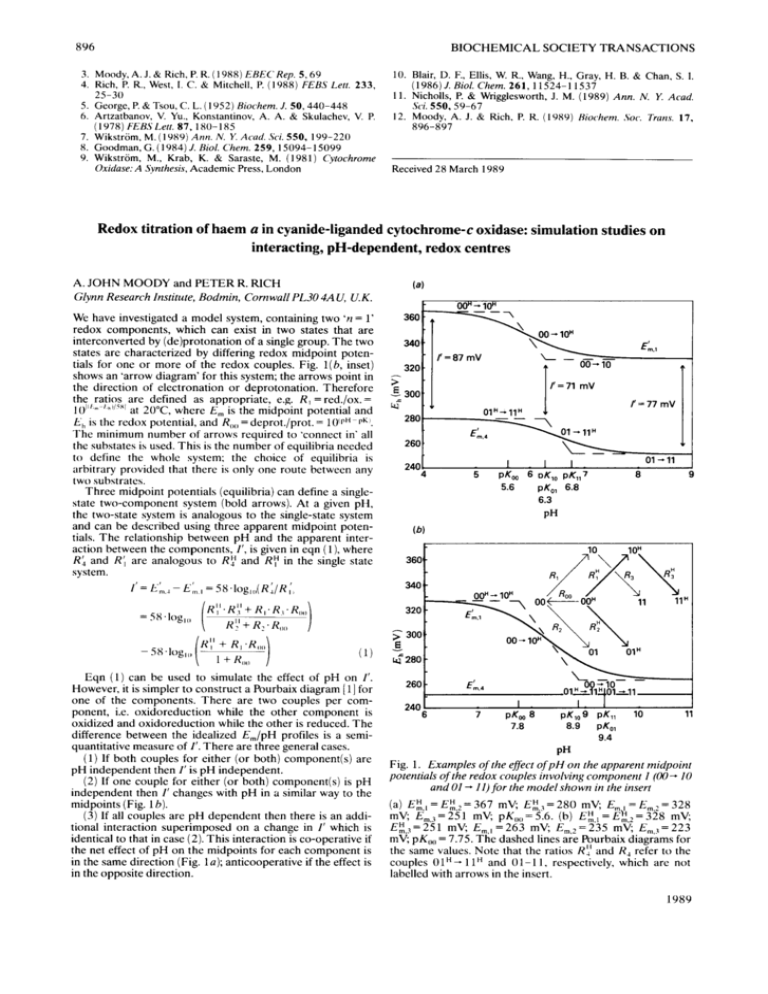
896 BIOCHEMICAL SOCIETY TRANSACTlONS 3. Moody, A. J. & Rich, P. R. ( 1 988) EBEC'Rep. 5 , 6 9 4. Rich, P. R., West, I. C. & Mitchell, P. ( 1 988) FEBS Lett. 233, 25-30 5. George, P. & Tsou, C. L. ( 1952) Biochem. J. 50,440-448 6. Artzatbanov, V. Yu.,Konstantinov, A. A. & Skulachev, V. P. ( 1978) FEBS Lett. 87, 180-1 85 7. Wikstrom, M. ( 1 989) A n n . N . Y. Acad. Sci. 550, 199-220 8. Goodman, G. ( 1984) J. Biol. Chem. 259,15094- 15099 9. Wikstrom, M., Krab, K. & Saraste, M. (1981) Cytochrome Oxidase: A Synthesis, Academic Press, London 10. Blair, D. F., Ellis, W. R., Wang, H., Gray, H. B. & Chan, S. I. (1986)J.Biol. Chem. 261,11524-11537 11. Nicholls, P. & Wrigglesworth, J. M. (1989) Ann. N. Y. Acad. Sci. 5 50, 5 9-6 7 12. Moody, A. J. & Rich, P. K. ( 1989) Hiochern. Soc. Trcrns. 17, 896-897 Received 28 March 1989 Redox titration of haem a in cyanide-ligandedcytochrome-c oxidase: simulation studies on interacting, pH-dependent, redox centres A. JOHN MOODY and PETER R. RICH Glynn Research Institute, Bodmin, Cornwall PL30 4A U, U.K. We have investigated a model system, containing two '12 = 1' redox components, which can exist in two states that are interconverted by (de)protonationof a single group. The two states are characterized by differing redox midpoint potentials for one or more of the redox couples. Fig. l(6, inset) shows an 'arrow diagram' for this system; the arrows point in the direction of electronation or deprotonation. Therefore the ratios are defined as appropriate, e.g. R , = red./ox. = 1()I' l/W at 20"C, where Em is the midpoint potential and E,, is the redox potential, and R,,,,= deprot./prot. = 10'pH-pKI. The minimum number of arrows required to 'connect in' all the substates is used. This is the number of equilibria needed t o define the whole system; the choice of equilibria is arbitrary provided that there is only one route between any two substrates. Three midpoint potentials (equilibria)can define a singlestate two-component system (bold arrows). At a given pH, the two-state system is analogous to the single-state system and can be described using three apparent midpoint potentials. The relationship between pH and the apparent interaction between the components, 1', is given in eqn ( l ) ,where R; and R', are analogous to RY and RY in the single state system. 5.6 pKol 6.8 6.3 PH (b) 3601. 340 - 320 - 300 ' 6 v 4280 Eqn ( 1 ) can be used to simulate the effect of pH on 1'. However, it is simpler to construct a Pourbaix diagram [ 11 for one of the components. There are two couples per component, i.e. oxidoreduction while the other component is oxidized and oxidoreduction while the other is reduced, The difference between the idealized EJpH profiles is a semiquantitative measure of 1'. There are three general cases. (1) If both couples for either (or both) component(s) are pH independent then I' is pH independent. ( 2 ) If one couple for either (or both) component(s) is pH independent then I' changes with pH in a similar way to the midpoints (Fig. 1b). ( 3 ) If all couples are pH dependent then there is an additional interaction superimposed on a change in I' which is identical to that in case (2).This interaction is co-operative if the net effect of pH on the midpoints for each component is in the same direction (Fig. la); anticooperative if the effect is in the opposite direction. - 260 r 240 I 6 7 I PK, 8 7.8 I. 1 pKlO9 P K , ~ 10 8.9 PK,, 9.4 1 PH Fig. 1 . Examples of the effect of pH on the apparent midpoint potentials of the redox couples involving component I (00- 10 and 01 11)for the model shown in the insert - (a) E:,, = E:.z = 367 mV; E:,3 = 280 mV; Em = Em,:= 328 mV; Em,,=2S1 mV; pK,,,,=5.6. (b) E:,,=Ei,,=328 mV; E:,3 = 25 1 mV; Ern,'= 263 mV; Em-> = 235 mV; En,%? = 223 mV; pK,,,,= 7.75. The dashed lines are Pourbaix diagrams for the same values. Note that the ratios R:' and I?,refer to the couples 01"- l l H and 01-11, respectively, which are not labelled with arrows in the insert. 1989 897 630th MEETING, ABERYSTWYTH The two-state, two-component model cannot account for the effect of pH on the titration of haem a in cyanideliganded cytochrome-c oxidase over all of the range studied (6.2-9.2, see [2]). However, the parameters used for the simulations shown in Fig. 1 were chosen to illustrate how it can account for the effect over two limited ranges: ( a )6.2-7 and ( b )7 5 9 . 2 (component 1, haem a; component 2, Cu,). Combination of these two partial models into a three-state system involving sequential (de)protonation of two groups yields a model that fits well over the whole pH range (see curves in [ 2 ] ) . Wikstriim et al. [3] have shown that a model involving sequential (de)protonationof two groups, with pK values like those used here, can explain the pH dependency of haem a in unliganded oxidase (though at that time the interaction observed at haem a was entirely attributed to haem a3).The three-state model can also explain the results for COliganded oxidase. Component 2 is now an ‘n = 2’ component, comprising Cu, and haem a3,whose midpoint potential with oxidized interactant (Em,o) is more than 6 0 mV more positive than of haem a [4]. In this case, haem a titrates essentially as an ’ n = 1’ component with Em= Em,R(midpoint potential with reduced interactant) and the slight pH dependency [S]can easily be simulated, again using similar pK values to those used here. We conclude that the interaction between two components at a given pH for a system with two or more pH-dependent states is composed of two parts: ( a ) direct interaction, e.g. electrostatic, and/or ( b), indirect interaction, occurring via the linkage between the oxidoreduction of the components and the (de)protonation of one or more common acid/base groups. We propose a minimal model for cyanide-liganded cytochrome-c oxidase in which the oxidoreduction of both haem a and Cu,, but not Cu,, are linked to the (de)protonation of two common acid/base groups with well-separated pK values. This work was supported by a grant from the S.E.R.C. (No. GR/ F/176OS). I . Bockris. O M , & Reddy. A. K. N. (1973) Modern Elecirochemistry, p. 1 123, Plenum Press, London 2. Moody, A. J.. Mitchell, R. & Rich, P. R. ( 1 989) Riochern. Soc. Trans. 17,895-896 3. Wikstrom, M., Krab, K. & Saraste, M. (198 I ) Cyrochrome Oxidase: A Synthesis, Academic Press, London 4. Lindsay, J. G., Owen, C. S. & Wilson. D. F. (1975) Arch. Biochem. Biophys. 169,492-505 5. Ellis, W. R., Wang, H., Blair, D. F., Gray, H. B. & Chan, S. 1. ( 1986) Biochemistry 25.16 1 - I67 Received 28 March 1989 Does cytochrome-c oxidase exist in both low- and high-spin pulsed forms? NIKOLAOS IOANNIDIS and JOHN M. WRIGGLESWORTH Division of Biomolecular Sciences, Biochemistry Section, King’s College London, Camden Hill Road, London W8 7AH, U.K. Isolated cytochrome c oxidase (ferrocytochrome-c oxygen oxidoreductase EC 1.9.3.1) can exist in different forms, when in its oxidized state. The enzyme is considered to be in a ‘resting’ form, as obtained by some purifications, when it exhibits slow intramolecular electron transfer ( t , , z= SO s ) [ 11 and multiphasic cyanide-binding kinetics [2].In contrast, the ‘pulsed’ form of the enzyme shows fast intramolecular electron transfer [3] and monophasic cyanide-binding kinetics [2].The pulsed form was originally defined in kinetic terms from measurements of the oxidation rate of ferrocytochrome c when the reduced enzyme was exposed to an oxygen pulse [4].The species generated was characterized by a substantially higher turnover number, when compared to that of the ‘resting’ form 131. The optical properties of the two forms are different: it is well accepted that the ‘resting’ enzyme has a Soret maximum centred around 4 18 nm, while the pulsed form, immediately following a redox cycle, absorbs maximally at 428 nm. However, the latter absorption band seems to shift to lower values with time, a process strongly dependent on experimental conditions [ 51. In the present work, some of the properties of the decaying pulsed species produced by the reoxidation of the fully reduced 100 426 80 60 40 20 n ” 0 50 100 Time (min) 150 200 50 100 150 200 0 Time (s) Fig. 1. Spectral changes (a) arid rates of iritramolecular electron transfer (b) of the pulsed form of cytochrome-C oxidase at various rimes follo wing preparation ( a )Time-dependent changes of the Soret maximum. ( b )Rate of reduction of haems u ( 0 ) and a , ( w , A , A ) following the addition of sodium dithionite ( 2 5 mM) to the ‘resting’ form ( m ) and to the pulsed form 20 min (A ) and 120 min ( A ) after preparation. The enzyme (3-5 ,UM)was diluted in 0.1 M-potassium phosphate buffer, at pH 7.0, containing 0.5% (v/v) Tween 80. The rates of haem u reduction for all samples are shown ( 0 ) . Vol. 17
