Data processing in luminescence dating analysis - ePIC
advertisement
Data processing in luminescence dating analysis: an exemplary workflow using the
R package ‘Luminescence’
Margret C. Fuchsa,b,∗, Sebastian Kreutzerc , Christoph Burowd , Michael Dietzee , Manfred Fischerf , Christoph Schmidtf ,
Markus Fuchsc
a Department
of Periglacial Research, Alfred-Wegener-Institute for Polar and Marine Research, 14473 Potsdam, Germany
Laboratory, Institute of Applied Physics, TU Bergakademie Freiberg, 09596 Freiberg, Germany
c Department of Geography, Justus-Liebig-University Giessen, 35390 Giessen, Germany
d Institute for Geography, University of Cologne, 50923 Cologne, Germany
e Section 5.1 Geomorphology, GFZ German Research Centre for Geosciences, 14473 Potsdam, Germany
f Geographical Institute, Geomorphology, University of Bayreuth, 95440 Bayreuth, Germany
b Luminescence
Abstract
The first version of the R package ‘Luminescence’ was released and published in 2012. Since then, the package has been
continuously improved - by implementing further measurement protocols, adding age models, and extending functions.
In geoscientific applications, luminescence dating requires a series of data processing procedures. A comprehensive
and replicate analysis of luminescence data using the R package ‘Luminescence’, therefore, suggests combining selected
functions. With this contribution, we provide a practical example of a workflow from reading measurement data to age
modelling. The exemplary data processing routine is applied to an OSL data set of a fluvial sediment sample from the
Pamir Mountains.
Keywords: CRAN, data processing, OSL, Pamir, R templates
1. Introduction
The R package ‘Luminescence’ (Kreutzer et al., 2012)
provides a bundle of functions for the analysis of luminescence signals and related data. The feedback from
package users encouraged the developer team to revise,
upgrade and add functions, and to release supportive material such as a practical guide for its use (Dietze et al.,
2013) and various tutorials, available at the R Luminescence website (http://www.r-luminescence.de). The current package (version 0.3.3) equips the user with a flexible tool for various data processing steps, such as reading measurement data, fitting growth curves, calculating
equivalent doses, inferring dose distribution statistics and
applying age models. The open source code guarantees
full access to all calculations. One may adapt functions
according to individual requirements, taking advantage of
the R programming environment (R Core Team, 2014)
and any packages available through the Comprehensive R
Archive Network (CRAN, http://cran.r-project.org/).
In luminescence dating, a convenient workflow demands
a series of data processing steps to be reproduced for several samples. This suggests the use of R code templates
that define how data are passed through selected functions and how the output is processed. Nevertheless, the
application of luminescence methods to a broad range of
∗ corresponding
author
Email address: margret.fuchs@awi.de (Margret C. Fuchs)
Quaternary International
sediments affects various methodological aspects. Consequently, the selection of adequate analytical steps requires
adjustment and may be far beyond routine procedures.
Here, we can neither discuss the full range of data
processing needs nor provide a standard decision procedure for luminescence data analysis. We rather introduce
one example of how the R package ‘Luminescence’ can be
used. For illustration, we apply selected functions to an
optically stimulated luminescence (OSL) data set of fluvial sediments from the Panj river network in Pamir. We
focus on a typical workflow from loading the measurement
data into the R environment to statistical age modelling
without any age interpretation. The described workflow
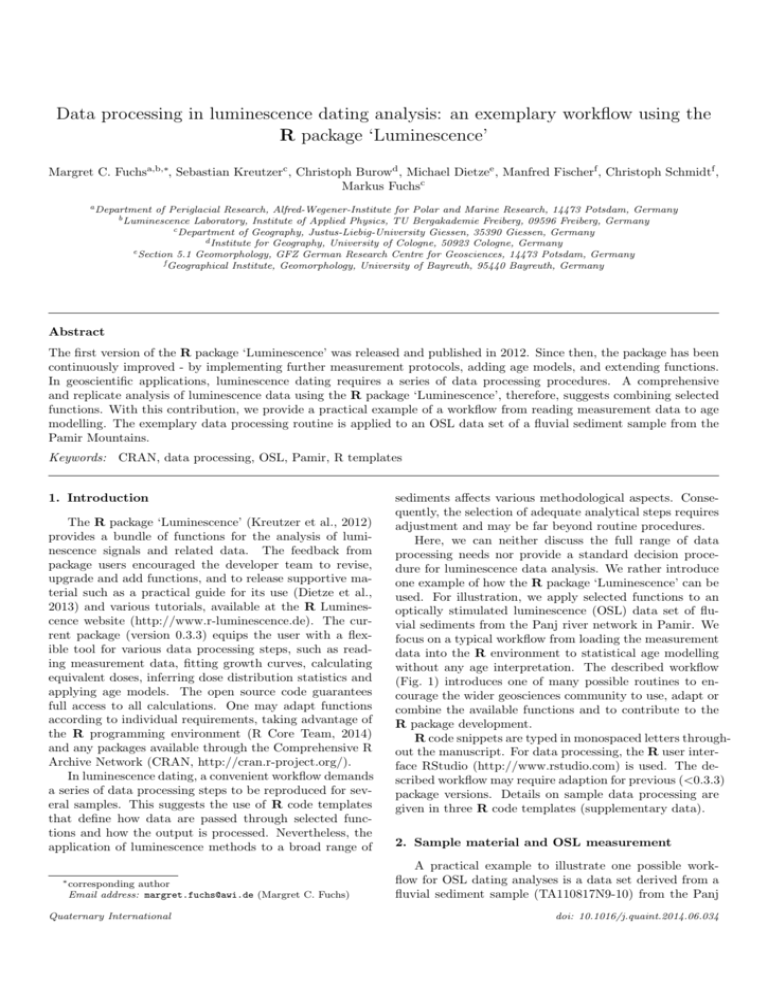
(Fig. 1) introduces one of many possible routines to encourage the wider geosciences community to use, adapt or
combine the available functions and to contribute to the
R package development.
R code snippets are typed in monospaced letters throughout the manuscript. For data processing, the R user interface RStudio (http://www.rstudio.com) is used. The described workflow may require adaption for previous (<0.3.3)
package versions. Details on sample data processing are
given in three R code templates (supplementary data).
2. Sample material and OSL measurement
A practical example to illustrate one possible workflow for OSL dating analyses is a data set derived from a
fluvial sediment sample (TA110817N9-10) from the Panj
doi: 10.1016/j.quaint.2014.06.034
R.Luminescence
Example for data processing
IN / OUTPUT DATA
VARIABLE
FUNCTION
read and analyse measurement data [examples]
setwd()
sample.BIN
BINfile
@METADATA
@DATA
[plot measurement data]
Analyse_SAR.OSLdata()
pos=1, run=2, set=1
OSL@125 °C
$LnLxTnTx
$RejectionCriteria
$SARParameters
1000
1500
2000
2500
SAR
0
500
LxTx.data
10
20
30
40
plot_GrowthCurve()
[plot dose response curve for position i ]
Growth Curve
growthcurve
De = 1622.49 +/− 130.67 s | fit: EXP
REG Points
REG Point repeated
REG Point 0
8
6
2
0
0
500
1500
2500
Second2Gray()
De.data
3500
Dose [s]
write.table()
sample_De_Gy.txt
De from Monte Carlo simulation
[De, error]
Test Dose Response
Tn Tx
0.95 1.20
15 30
0
Frequency
DeMC = 1615.33 +/− 130.67 | quality = 99.6 %
1200
1600
get_RLum.Results()
data.frame[De, error] }
De.data
●
4
Lx Tx
●
data.object = "De"
data.object = "Fit"
●
●
●
for(i in position) {
as.data.frame(
cbind(SAR[[1]][[i]]
[c(dose, LxTx, error, TnTx)]))
50
growth curve.pdf
●
position <- c(min() : max())
plot_Risoe.BINfileData()
luminescence signals.pdf
0
readBIN2R()
2000
●
●
●
1
Dose [s]
n.iterations = 100 , valid fits = 100
●
●
●
●
3
5
7
analyse and plot dose distribution data [examples]
SAR cycle
read.table()
De.data
as.data.frame()
De.data
rbind()
plot_KDE()
De distribution.pdf
centrality = c(“kdemax“)
stats = c(N, mean, sd, se)
[KDE or Radial Plot]
De Distribution
20
De distribution
n = 20
mean = 147.04
sd = 44.7 %
●
●
350
300
250
15
median
0.25 and 0.75 quartiles
10
Density
0.004
●
●
●
●
Cumulative frequency
Standardised estimate
0.006
●
●
●
●
●
200
150
2
0
−2
De [Gy]
0.008
KDE max
mean
●
n = 20
mean = 147.04
abs. se = 14.7
rel. sd = 46.95
●
100
0.002
●
●
plot_RadialPlot()
50
5
●
●
●
Relative error [%]
0.000
●
●
100
200
300
400
0
20
10
5
10
6.7
5
4
3.3
15
20
25
30
Precision
De [Gy]
age models [examples]
De Distribution
20
TA110817N13−14_OSL_4_ed | sigmab = 0.42
●
●
0.006
●
●
FMM comp. 2: 143.25 ± 16.23
MAM3: 128.08 +16.67/−33.57
calc_FiniteMixture()
10
0.004
●
●
●
●
Cumulative frequency
●
●
●
Density
De.data
n = 20
mean = 147.04
abs. se = 14.7
KDE max = 135.3
15
0.008
KDE max
mean
●
●
FMM
data.object = "components"
abline (v = FMMcomp)
abline (v = mindose)
0.002
●
5
●
●
●
MAM
●
0.000
●
●
100
200
300
sigmab
n.components
data.object = "mindose"
calc_MinDose3()
sigmab
400
De [Gy]
detailed documentation: http://www.r-luminescence.de
2013-11-11
Figure 1: Flow chart of exemplary data processing in luminescence dating analysis. Exemplary variable and data names are chosen for
straightforward comprehension of the content. The flow chart comprises three major steps (light grey boxes): data input and analyses of
measured signal, dose distribution analyses, age modelling. Arrows indicate the flow of variables as modified by R-functions (within/between
light grey boxes) or data input and output options (in/out of light grey boxes). R code snippets are typed in monospaced letters)
.
River, situated in the Pamir mountains. The regional geology, climate and the geomorphometry of the drainage
system is described in Fuchs et al. (2013). The site is part
of a complex terrace system along the Murgab River at
the eastern Pamir Plateau (N 38.155 012°, E 73.968 168°,
3,599 m a.s.l.). The sampled sediment consists of wellsorted, layered sand 23 m below the terrace surface. The
measurements to determine the equivalent dose (De ) for
OSL dating were conducted on the coarse-grained quartz
fraction (90 – 160 µm), using a single aliquot regenerative
dose (SAR) protocol after Murray and Wintle (2000). Based
on multiple grain SAR measurements, 20 medium size
(4 mm) aliquots were measured. The SAR cycles were first
applied to measure the natural signal, followed by six regeneration cycles (R1 to R6), including one to measure
the recuperation (R5) and one to measure the recycling
ratio (R6). Finally, an infrared stimulation cycle was performed using the same dose as for R1. Alongside the 20
aliquots measured for De determination, four additional
aliquots (position 21 – 24) were measured to record signals
from a dose recovery test (Murray and Wintle, 2003). All
measurements were conducted using a standard Risø DA20 TL/OSL reader (90 Sr/90 Y beta source ∼5.6 Gy/min,
CW-OSL, blue LEDs at 470 nm and 90 % optical power,
7.5 mm U340 Hoya filter, Bøtter-Jensen et al., 2000; Thomsen et al., 2006), which stores the measurement data in the
.BIN file (version 03) format.
3. Data processing steps
The R package ‘Luminescence’ offers various functions
to process the measurement data, such as any equivalent dose data stored in a .BIN or .BINX file (see supplementary data for a complete list of available functions).
The recommended workflow includes three main analytical steps: (1) reading and analysing the measurement data,
(2) analysing and plotting the dose distribution data, and
(3) applying the age models. Figure 1 illustrates the workflow, including how the data can be handled with selected
analytical functions, how variables can be used, and which
plots can be generated.
3.1. Read and analyse measurement data
In order to analyse the OSL signal properties of the
Pamir sample, the measurement data was first loaded into
R. The presented example data is stored in a .BIN file.
Other file formats such as .BINX are also fully supported.
The data was imported by readBIN2R() and stored in a
variable, here called BINfile (Fig. 1). The details on the
measured sequence are available through metadata by selecting the desired rows and columns of the slot. Luminescence signal data is available through the DATA slot of the
BINfile variable.
> BINfile <– readBIN2R(<your data>)
> BINfile@METADATA[1:30, c(2, 7, 8, 9, 22, 31, 45)]
> BINfile@DATA
For this data set, aliquot positions 1 to 20 were chosen to
investigate the OSL signal properties, while positions 21
to 24 were bleached and dosed before applying the SAR
protocol. The function plot_Risoe.BINfileData() plots
OSL curve data for each stimulation run of the SAR protocol for all selected positions. The output can be returned
to the screen or saved to the working directory using R
internal functions such as pdf().
> BINfile@METADATA$POSITION
> aliquot.position <- 1:20
> plot_Risoe.BINfileData(BINfileData = BINfile,
position = aliquot.position,
sorter = "POSITION",
ltype = "OSL")
Background and sensitivity corrected initial signals of
each OSL curve were calculated and grouped according
to position by Analyse_SAR.OSLdata(). The integrals
for the initial signal and for the background were set to
1 – 5 (1 s) and 200 – 250 (10 s), respectively. Given values
represent examples and may be modified due to the individual requirements of analysed data. A variable named
SAR was introduced that contains the results of integral
calculations for each regeneration cycle (R1 – R6) in the
component $LnLxTnTx (Fig. 1). Additionally, the function returns recycling ratio estimates (R6 / R2), recuperation values (R5 / natural signal) in $RejectionCriteria,
and SAR parameters.
> SAR <- Analyse_SAR.OSLdata(input.data = BINfile,
signal.integral = <min> : <max>,
background.integral = <min> : <max>,
position = aliquot.position)
> SAR$LnLxTnTx
> SAR$RejectionCriteria
> SAR$SAR
The dose response curve and the De of the natural
signal were determined by fitting exponential curves to
the SAR signals (Lx /Tx values) of each aliquot. This was
performed by the function plot_GrowthCurve(), which
requires a data frame of three columns containing regeneration doses, corrected OSL signals, and signal errors.
Therefore, the respective data of the selected aliquot position i was passed from SAR$LnLxTnTx to a new data frame,
here named LxTx.data.
> select.aliquot <- i
> LxTx.data <- as.data.frame(cbind(SAR[[1]]
[[select.aliquot]][c(2, 12, 13, 6)]))
The variable LxTx.data was then used to run the
plot_GrowthCurve() function. The output.plot parameter enables printing of results, for example as a .pdf file.
Results from the plot_GrowthCurve() function were returned as an ”S4 object” , here named growthcurve (Fig. 1).
Estimated De and curve fitting parameters were addressed
through
the
data
slot
using
the
function
3.2. Analyse and plot dose distribution data
get_RLum.Results() and selecting, for example, the data
The fluvial origin of the Pamir sample demands for
object ”De”. Results may be stored in an empty data.frame()statistical analysis of replicated equivalent dose measureof a certain number of columns and filled with missing valments to determine the degree of bleaching and the most
ues (NA).
likely paleodose (e.g., Galbraith et al., 1999; Bailey and
> pdf()
> growthcurve <- plot_GrowthCurve(sample = LxTx.data,
output.plot = TRUE)
> dev.off()
> get_RLum.Results(growth.curve, data.object = "De")
> De.data <- data.frame(De = NA, De.error = NA)
> De <- get_RLum.Results(growth.curve,
data.object = "De")
> De.data[,1] <- De[1]
> De.data[,2] <- De[2]
A two column data frame of equivalent doses and related errors is required for further dose distribution statistics and age models of the R package ‘Luminescence’. An
effective way to analyse all selected aliquot positions from
measured signal to De estimate is provided by the loop
for() as illustrated in Fig. 1. The loop repeats signal
extraction from individual SAR cycle measurements including growth curve estimation for the aliquot positions
1 to 20, and passes all De and respective error to a data
frame termed De.data (for a detailed example see also the
R template 1 in the supplementary material).
The reliability of the De calculation can be assessed
using, for example, the recycling ratio and recuperation
values returned by Analyse_SAR.OSLdata(). Respective
data was stored in the slot Rejection.Criteria of the
variable SAR. Recycling ratio and recuperation of 10 %
and 5 %, respectively, were included to illustrate De selection for the Pamir sample. Template 1 (supplementary
material) includes an example of how to implement rejection criteria and change thresholds as needed. The data
in the variable SAR or growthcurve may be adopted to
derive further rejection criteria (e.g., signal to background
ratio, De error) depending on the user’s research focus or
requirements.
The De.data values of the Pamir sample were given in
seconds as irradiation times were given in seconds. To convert the data to the unit Gray (Gy) the package provides
the function Second2Gray(). It requires the De data and
the dose rate of the β-source along with its error. In case
the dose rate of the β-source at the date of measurement
is unknown, the R template 1 (supplementary material)
shows an example of the calculation based on the last βsource calibration and the date of measurement. The variable De.data can be saved as a .txt file for further usage.
> De.data <- Second2Gray(De.data, c(
<dose.rate>, <dose.rate.error>))
> write.table(De.data, file = "<name>.txt")
Arnold, 2006; Duller, 2008). Basically, the R package ‘Luminescence’
offers
three
functions
for
dose
distribution visualisation: plot_KDE(), plot_RadialPlot()
and plot_Histogram(). Any two-column data can be
used as input data: the De.data from previous analyses
or any other data frame loaded into the R environment.
The input data may require several preparation steps (see
R template 2 in the supplementary material). This includes selecting the correct data columns with the equivalent doses and errors, removing missing values for aliquot
positions which yielded no equivalent dose, and sorting
values in ascending order. Although not essential for the
plot functions, it is convenient to sort the data for later
use with age models (see below and R template 3 in the
supplementary material). Finally, the variable De.data is
converted to a data frame.
>
>
>
>
De.data <- read.table("<name>.txt")
De.data <- De.data[,1:2]
De.data <- na.omit(De.data)
De.data <- De.data[order(De.data[,1],
decreasing = FALSE),]
> De.data <- as.data.frame(De.data)
The dose distribution of the Pamir sample was plotted
by plot_KDE(). The function illustrates the variability
of De by kernel density estimates (KDE). Basic statistic measures were added to the plot by the parameters
centrality for vertical lines indicating the position of
central measures within the distribution, and stats for
numerical output of descriptive statistics (Fig. 1). The
plot output is again saved as a separate .pdf file (see R
template 2 in the supplementary material).
> pdf()
> plot_KDE(De.data,
centrality = c("kdemax", "median"),
stats = c("n", "mean", "seabs", "sdrel",
"skewness"))
> dev.off()
The Pamir example data showed a positively skewed
distribution (skewness of 1.13) with the mean higher than
the median and the maximum density of De values. The
high standard deviation of ∼47 % supports the indication
of differential bleaching (e.g., Bailey and Arnold, 2006;
Arnold et al., 2007). Consequently, the paleodose calculation is based on further age modelling to extract the
well-bleached portion of all De .
3.3. Age models
In the case of abnormal dose distributions, the paleodose calculation based on the arithmetic mean is not
appropriate. This leads to an over- or underestimation
of the true burial dose, and to miscalculating the luminescence age (e.g., Olley et al., 1998; Murray and Olley, 2002; Rodnight et al., 2006; Bailey and Arnold, 2006;
Arnold et al., 2007). For such dose distributions, several
age models (e.g., Galbraith and Green, 1990; Galbraith
et al., 1999; Fuchs and Lang, 2001; Lepper and McKeever,
2002) have been introduced and are now in common use
throughout the published literature. Functions for the
most common models are available in the R package ‘Luminescence’ (complete list of available age models given in
supplementary material). The decision on the appropriate age model is essentially dependent on various aspects
concerning the sampled sediments and applied measurement procedure (e.g., Arnold and Roberts, 2009; Arnold
et al., 2012). It stays with the user to decide which age
model to choose from the set of available functions in the R
package ‘Luminescence’. Although the human eye is very
good in recognizing patterns, package users may also use
statistic measures to evaluate dose distributions. One simple way to identify abnormal distributions is, for example,
the comparison of the arithmetic mean and median. Additionally, the R package ‘Luminescence’ provides a function
calc_Statistics() that returns a number of descriptive
statistic estimates such as skewness.
The minimum age model (MAM, Galbraith et al., 1999)
was applied to the Pamir sample to address the differential bleaching observed in dose distributions. The variable
De.data was again used as the input parameter for the
functions calc_MinDose3(). Sigmab is essential for the
MAM as an estimate of the sample’s overdispersion. A
wide range of sigmab from 0.01 to 0.4 was found in fluvial
material of different geographical regions (Arnold et al.,
2007; Arnold and Roberts, 2009). Hence, a value of 0.3
may be chosen, which is well within the reported range.
However, choosing an appropriate sigmab value is nontrivial and depends on various aspects, such as measurement conditions and number of grains per aliquot (Galbraith and Roberts, 2012). Galbraith and Roberts (2012)
emphasize that sigmab should be estimated individually
for each sample and suggest using the central age model according to Galbraith et al. (1999) for that purpose. In our
example case the function calc_CentralDose() reveals an
overdispersion of 0.42. Incorporating this value as sigmab
improves the MAM performance in that the resulting minimum dose is less biased by the two lowermost values of the
dose distribution (cf. graph of the KDE). The user may be
reminded to carefully set sigmab according to the analysed
data. The age model function returns model results as an
”S4 object”. Using the variable MAM, individual data objects were then adressed by get_RLum.Results(). The
data object "results" was called to derive the minimum
dose.
> MAM <- calc_MinDose3(De.data,
sigmab = <value>),
> MAM.results <- get_RLum.Results(MAM,
data.object = "results")
> mindose <- MAM.results$mindose
The finite mixture model (FMM, Galbraith and Green,
1990) is included in Figure 1 and template 3 (supplementary material). The FMM is not appropriate for the exemplary data set from the Pamir as multiple grain aliquots
were used for measurements (e.g., Arnold and Roberts,
2009; Arnold et al., 2012), and the FMM is envisioned only
for single grain data (Galbraith and Green, 1990). Nevertheless, the corresponding calc_FiniteMixture() is integrated in the template 3 (supplementary material) as an
example of how to apply further age models. Apart from
the sigmab, the FMM requires the number of components
fitted to the dose distribution. The results of distribution
unmixing are addressed by get_RLum.Results() and the
data object "components". The R template 3 (supplementary material) shows how to routinely get the central
values of individual components and determine the paleodose according to the FMM component with the highest
proportion.
Age model results can be displayed, for example, using
the plot_KDE() function. Adding lines by abline() for
the minimum dose and FMM components identifies the
parts of the dose distribution that MAM and FMM results
are based on. Information on age model results was added
to the legend by text() before saving the plot (for details
see R template 3 supplementary material).
> pdf()
> plot_KDE(De.data,
centrality = c("kdemax", "median"))
> abline(mindose)
> dev.off()
4. Conclusions
A fluvial sediment sample from the Pamir mountains
is used to demonstrate the performance of the R package
‘Luminescence’ for OSL data analyses. We have described
the data processing - including all steps from data evaluation after OSL measurements to statistical analyses using
age models - in detail. We have illustrated how functions
provided by the package can be combined via variables and
R internal functions to take full advantage of the analytical and plotting possibilities of the R environment. The
described workflow introduces one of many possible routines as an invitation to the wider geosciences community
to use, adapt or combine the available functions and to
contribute to the R package development.
5. Acknowledgments
We are thankful to the R Coreteam for providing the
R programming environment (R Development Core Team,
2014) and the CRAN mirrors for open access to the package
‘Luminescence’
(http://cran.r-project.org/web
/packages/Luminescence/index.html). We performed all
analysis
steps
using
the
interface
RStudio
(http://www.rstudio.com/). Our ambition to develop and
improve the R package ‘Luminescence’, is funded by the
DFG network programm SCHM 3051/3-1. The work of
the corresponding author was gratefully funded by the
DFG in the frame of the TIPAGE bundle project (GI361/41) and benefited greatly from the supervision of Richard
Gloaguen.
References
Arnold, L.J., Bailey, R.M., Tucker, G.E., 2007. Statistical treatment of fluvial dose distributions from southern Colorado arroyo
deposits. Quaternary Geochronology 2, 162–167.
Arnold, L.J., Demuro, M., Ruiz, M.N., 2012. Empirical insights
into multi-grain averaging effects from ‘pseudo’ single-grain OSL
measurements. Radiation Measurements 47, 652–658.
Arnold, L.J., Roberts, R.G., 2009. Stochastic modelling of multigrain equivalent dose (De ) distributions: Implications for OSL
dating of sediment mixtures. Quaternary Geochronology 4, 204–
230.
Bailey, R.M., Arnold, L.J., 2006. Statistical modelling of single grain
quartz De distributions and an assessment of procedures for estimating burial dose. Quaternary Science Reviews 25, 2475–2502.
Bøtter-Jensen, L., Bulur, E., Duller, G.A.T., Murray, A.S., 2000.
Advances in luminescence instrument systems. Radiation Measurements 32, 523–528.
Dietze, M., Kreutzer, S., Fuchs, M.C., Burow, C., Fischer, M.,
Schmidt, C., 2013. A practical guide to the R package Luminescence. Ancient TL 31, 11–18.
Duller, G.A.T., 2008. Single-grain optical dating of Quaternary sediments: Why aliquot size matters in luminescence dating. Boreas
37, 589–612.
Fuchs, M., Lang, A., 2001. OSL dating of coarse-grain fluvial quartz
using single-aliquot protocols on sediments from NE-Peloponnese,
Greece. Quaternary Science Reviews 20, 783–787.
Fuchs, M.C., Gloaguen, R., Pohl, E., 2013. Tectonic and climatic
forcing on the Panj river system during the Quaternary. International Journal of Earth Sciences 102, 1985–2003.
Galbraith, R.F., Green, P.F., 1990. Estimating the component ages
in a finite mixture. Nuclear Tracks and Radiation Measurements
17, 197–206.
Galbraith, R.F., Roberts, R.G., 2012. Statistical aspects of equivalent dose and error calculation and display in OSL dating: An
overview and some recommendations. Quaternary Geochronology
, 1–27.
Galbraith, R.F., Roberts, R.G., Laslett, G.M., Yoshida, H., Olley,
J.M., 1999. Optical dating of single and multiple grains of quartz
from Jinmium Rock Shelter, Northern Australia: Part I, Experimental design and statistical models. Archaeometry 41, 339–364.
Kreutzer, S., Schmidt, C., Fuchs, M.C., Dietze, M., Fischer, M.,
Fuchs, M., 2012. Introducing an R package for luminescence dating analysis. Ancient TL 30, 1–8.
Lepper, K., McKeever, S.W.S., 2002. An objective methodology for
dose distribution analysis. Technical Report.
Murray, A.S., Olley, J.M., 2002. Precision and accuracy in the optically stimulated luminescence dating of sedimentary quartz: A
status review. Geochronometria 21, 1–16.
Murray, A.S., Wintle, A.G., 2000. Luminescence dating of quartz
using an improved single- aliquot regenerative-dose protocol. Radiation Measurements 32, 57–73.
Murray, A.S., Wintle, A.G., 2003. The single aliquot regenerative
dose protocol: Potential for improvements in reliability. Radiation
Measurements 37, 377–381.
Olley, J., Caitcheon, G., Murray, A., 1998. The distribution of apparent dose as determined by optical stimulated luminescence in
small aliquots of fluvial quartz: Implications for dating young sediments. Quaternary Geochronology 17, 1033–1040.
R Core Team, 2014. R: A Language and Environment for Statistical Computing. R Foundation for Statistical Computing. Vienna,
Austria. URL: http://www.R-project.org.
Rodnight, H., Duller, G.A.T., Wintle, A.G., Tooth, S., 2006. Assessing the reproducibility and accuracy of optical dating of fluvial
deposits. Quaternary Geochronology 1, 109–120.
Thomsen, K.J., Bøtter-Jensen, L., Denby, P.M., Moska, P., Murray, A.S., 2006. Developments in luminescence measurement techniques. Radiation Measurements 41, 768–773.
