AAS vs ICP
advertisement
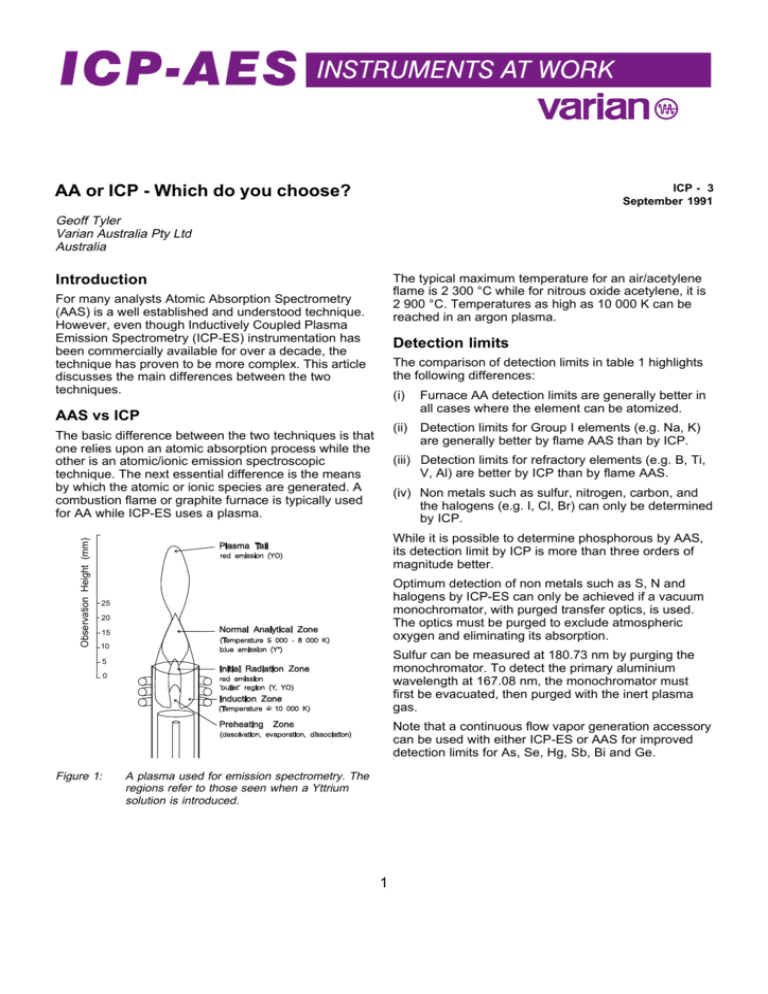
ICP - 3 September 1991 AA or ICP - Which do you choose? Geoff Tyler Varian Australia Pty Ltd Australia The typical maximum temperature for an air/acetylene flame is 2 300 °C while for nitrous oxide acetylene, it is 2 900 °C. Temperatures as high as 10 000 K can be reached in an argon plasma. Introduction For many analysts Atomic Absorption Spectrometry (AAS) is a well established and understood technique. However, even though Inductively Coupled Plasma Emission Spectrometry (ICP-ES) instrumentation has been commercially available for over a decade, the technique has proven to be more complex. This article discusses the main differences between the two techniques. Detection limits The comparison of detection limits in table 1 highlights the following differences: AAS vs ICP Observation Height (mm) The basic difference between the two techniques is that one relies upon an atomic absorption process while the other is an atomic/ionic emission spectroscopic technique. The next essential difference is the means by which the atomic or ionic species are generated. A combustion flame or graphite furnace is typically used for AA while ICP-ES uses a plasma. Furnace AA detection limits are generally better in all cases where the element can be atomized. (ii) Detection limits for Group I elements (e.g. Na, K) are generally better by flame AAS than by ICP. (iii) Detection limits for refractory elements (e.g. B, Ti, V, Al) are better by ICP than by flame AAS. (iv) Non metals such as sulfur, nitrogen, carbon, and the halogens (e.g. I, Cl, Br) can only be determined by ICP. While it is possible to determine phosphorous by AAS, its detection limit by ICP is more than three orders of magnitude better. Plasma Tail Optimum detection of non metals such as S, N and halogens by ICP-ES can only be achieved if a vacuum monochromator, with purged transfer optics, is used. The optics must be purged to exclude atmospheric oxygen and eliminating its absorption. 25 20 15 (i) Normal Analytical Zone 10 Sulfur can be measured at 180.73 nm by purging the monochromator. To detect the primary aluminium wavelength at 167.08 nm, the monochromator must first be evacuated, then purged with the inert plasma gas. 5 0 Initial Radiation Zone Induction Zone ≈ Preheating Figure 1: Zone Note that a continuous flow vapor generation accessory can be used with either ICP-ES or AAS for improved detection limits for As, Se, Hg, Sb, Bi and Ge. A plasma used for emission spectrometry. The regions refer to those seen when a Yttrium solution is introduced. 1 Sample throughput Ionization In ICP-ES, the rate at which samples may be determined depends on the type of instrument: both simultaneous and sequential ICP spectrometers are available. Most ICP spectrometers purchased are the sequential type, providing maximum flexibility of choice of element and analytical wavelength. Surveys have shown that most analysts are interested in 6-15 elements per sample and choose to pump the sample (which increases washout times) to improve precision and accuracy by minimizing viscosity effects. Simultaneous ICP spectrometers demonstrate an advantage in analytical speed over sequential ICP spectrometers when more than 6 elements/sample are measured. The ICP contains a large number of free electrons, so ionization interferences for most applications are virtually nonexistent. Ionization interferences can be encountered when determining elements in matrices that contain very high concentrations of Group I elements (e.g. Na & K). However, these effects can be minimized by optimizing the plasma viewing height. Ionization interferences may also be found in AAS, e.g. when measuring certain Group II elements in a nitrous oxide flame. An ionization buffer such as Cs, Li or K can be added to both samples and standards to minimize this effect. Spectral If a ‘one off’ sample is presented for a few elements, flame AAS is faster. However, with flame equilibration time, program recall and monochromator condition changes, the cross over point where sequential ICP becomes faster than AAS is approximately 6 elements/ sample for routine analysis. The optical requirements of AAS are fairly simple. The monochromator only needs to distinguish a spectral line emitted from the hollow cathode lamp from other nearby lines. The lamp itself only emits a few spectral lines. Most elements require 0.5 nm resolution with only iron, nickel and cobalt of the common elements requiring 0.2 nm or better. Unattended operation Flame AAS cannot be left completely unattended for safety reasons. An ICP-ES instrument or graphite furnace AA can be left to run overnight as no combustible gases are involved, effectively increasing the working day from 8 hours to 24 hours. In ICP-ES, the rich spectra present in the plasma means that there is a greater possibility of spectral interference. Spectral resolutions of 0.010 nm or better are required to resolve nearby interfering lines from the atomic and ionic analytical emission signals of interest. Linear dynamic range Spectral interference in sequential ICP spectrometers can, in most cases, be overcome by selecting a different elemental wavelength with similar detection limits. With simultaneous ICP spectrometers, the elements and the wavelengths which may be determined are fixed at the time of purchase, and an alternative line may not be available. In this case, interelement correction may be used to minimize the spectral interference. The inductively coupled plasma is doughnut shaped (with a ‘hollow’ centre). The sample aerosol enters the base of the plasma via the injector tube. The ‘optical thinness’ of the ICP results in little self absorption and is the main reason for the large linear dynamic range of about 105. For example, copper can be measured at the 324.75 nm wavelength from its detection limit of about 0.002 ppm to over 200 ppm. In ICP, extrapolation of two point calibrations can be accurately used to achieve orders of magnitude above the top standard. This compares to a linear dynamic range of typically 103 for AAS. Physical These interferences relate to the different properties of various samples and can affect sample transport and droplet formation. ICP tends to be more susceptible to such interference because of the smaller droplet size required and lower transport efficiency. Interferences Chemical Precision Chemical interferences are relatively common in AA, especially with graphite furnace AA, but may be minimized with chemical modifiers. Precision can be termed short term (or within-run) and long term (over a period of one day). For AAS a precision of 0.1-1% is typical for the short term, but recalibration is required over a longer period. With ICP-ES the short term precision is typically 0.3-2%, but precisions of 2-5% are not uncommon over an 8 hour period without recalibration. ICP-ES is almost free from chemical interferences. The chemical bonds that still exist at below 3000 °C are completely ruptured at above 6000 °C. The high temperatures reached in a plasma eliminate chemical interferences, which accounts (for the most part) for the better detection limits achieved for refractory elements. 2 One technique used to eliminate backlash in the grating drive mechanism of ICP spectrometers is by scanning and measuring at the same time. This method of measurement can be termed as ‘measurement on the move’ and effectively results in poor short term precision. A more recent method drives the grating to a wavelength near the analytical peak. A refractor scan is then performed over a smaller wavelength region in order to identify and locate the peak position. Finally the refractor plate is repositioned ‘at the peak’ where the replicate measurements are then performed. This method offers better precision. (d) What are the typical sample volumes? (e) What elements need to be determined? (f) What concentration ranges are present in the matrices? (g) Would an Internal Standard be useful? For example, where the samples may change in viscosity from sample to sample, e.g. battery acid analysis. (h) What expertise do the operators have? (i) How much money is available to purchase or lease costs/month? (j) Cost of ownership and running costs. Can the user afford an automated AAS or ICP-ES, or is a simple AAS sufficient? Analytical requirements Before deciding which technique is appropriate, the chemist must define both present and future analytical requirements. That is: The answers to these questions will help you to decide which is the preferred technique. Sometimes the answer is further complicated by the fact that neither flame AAS nor ICP-ES will satisfy all requirements. You may find, as many do, that both an ICP-ES and a furnace AAS will be necessary to meet the analytical requirements. (a) Number of samples/week? (b) What matrices need to be analyzed? e.g. steels, bronzes, effluents, soils, etc. (c) How many elements need to be determined for each sample type? 3 AAS v ICP - A quick guide ICP-OES Detection Flame AAS Furnace AAS Best for : Limits Refractories Best for : Best for : Group I metals All elements Non metals Na, K except : B,W,U, P, S, B, Al Volatile elements Refractories, eg V, Ba, Ti Pb, Zn P, S Halogens Rare Earths Sample Best if more than Best if less than Slow (typically Throughput 6 elements/sample 6 elements/sample 4 mins/element) Linear Dynamic Range 105 103 102 0.3 - 2% Less than 5% 0.1 - 1% 0.5 - 5% Interferences Spectral Many Virtually None Minimal Chemical Ionization Virtually None Minimal Some Some Many Minimal Low Yes Relatively high No Precision Short Term Long Term (over 8 hrs) Operating costs High Combustible gases No 4 Table 1 Guide to ICP/AAS Analytical Values Element ICP λ (nm) AA Silver Ag Aluminium Al Arsenic As Gold Au Boron B Barium Ba Beryllium Be Bismuth Bi Bromine Br Carbon C Calcium Ca Cadmium Cd Cerium Ce Chlorine Cl Cobalt Co Chromium Cr Cesium Cs Copper Cu Dysprosium Dy Erbium Er Europium Eu Iron Fe Gallium Ga Gadolinium Gd Germanium Ge Hafnium Hf Mercury Hg Holmium Ho Iodine I Indium In Iridium Ir Potassium K Lanthanum La Lithium Li Lutetium Lu Magnesium Mg Manganese Mn Molybdenum Mo Nitrogen N Sodium Na Niobium Nb Neodymium Nd Nickel Ni Osmium Os Phosphorous P Lead Pb Palladium Pd Praseodymium Pr Platinum Pt Rubidium Rb Rhenium Re 328.1 309.3 193.7 242.8 249.8 553.6 234.9 223.1 422.7 228.8 520.0 240.7 357.9 852.1 324.7 421.2 400.8 459.4 248.3 294.4 368.4 265.1 307.3 253.7 410.4 303.9 208.9 766.5 550.1 670.8 336.0 285.2 279.5 313.3 589.0 334.9 492.5 232.0 290.9 213.6 217.0 244.8 495.1 265.9 780.0 346.1 ICP 328.068 167.081 188.985 267.595 249.773 455.403 313.042 223.061 163.340 247.856 393.366 228.802 418.660 725.665 228.616 267.716 455.531 324.754 353.170 337.271 381.967 259.940 417.206 342.247 265.118 264.141 184.950 345.600 178.276 325.609 224.268 766.490 379.478 670.784 261.542 279.553 257.610 202.030 174.272 588.995 309.418 401.225 231.604 225.585 177.499 220.353 340.458 417.939 265.945 780.023 227.525 Flame AA Zeeman Furnace AA Detection Characteristic Detection Limit Conc Limit µg/L µg/L µg/L 3 1.5 12 5.5 1.5 0.07 0.2 12 6000 65 0.03 1.5 7.5 200000 5 4 3200 2 0.3 0.7 0.3 1.5 6.5 2.5 13 4 8.5 0.5 60 18 3.5 10 0.02 0.6 0.05 0.1 0.3 4 50 000 1 4 2 5.5 5 18 14 7 0.8 20 35 11 FlameCharacteristic# Type MSR Conc+ Mass µg/L pg % El 97 100 86 94 70 100 64 88 Ag Al As Au B Ba Be Bi Br C Ca Cd Ce Cl Co Cr Cs Cu Dy Er Eu Fe Ga Gd Ge Hf Hg Ho I In Ir K La Li Lu Mg Mn Mo N Na Nb Nd Ni Os P Pb Pd Pr Pt Rb Re 30 800 500 100 8000 200 15 200 2 30 300 10 500 20 1 50 Air N2O N2O Air N2O N2O N2O Air 0.035 0.25 0.5 0.22 43 0.85 0.025 0.45 0.7 5 10* 4.4 855* 17 0.5 9 10 10 100000 1 2 100000 N2O Air N2O 0.03 0.01 0.6 0.2* 50 50 20 30 600 500 300 50 800 20000 1000 10000 1500 700 5 6 4 3 30 50 1.5 6 100 2000 200 2000 200 40 Air N2O Air Air N2O N2O N2O Air Air N2O N2O N2O Air N2O 0.21 0.075 0.55 0.3 2.3 5 1.3 0.06 0.23 4.2 1.5 11 6 45 100 25 1.2 4.5* 0.45 9* 7.5 150* 150 800 7 40000 20 7000 3 20 300 40 500 3 2000 2 300 0.3 2 20 Air Air Air N2O Air N2O Air Air N2O 0.35 6.8 0.02 7.0* 135 0.4 0.2 4 0.01 0.03 0.35 0.2 0.6 7 3 20000 6000 70 1000 120000 100 50 20000 1000 50 8000 0.2 2000 1000 10 100 40000 10 10 10000 100 10 1000 Air N2O N2O Air N2O N2O Air Air N2O Air Air N2O 0.005 0.1 5 0.24 110 0.28 0.43 3.5 0.05 94 87 98 100 58 84 100 100 100 97 80 100 69 100 97 90 49 75 92 96 92 4.8 98 2200* 69 5.5 92 8.6 100 70 82 1 90 - Guide to ICP/AAS Analytical Values Element ICP λ (nm) AA Rhodium Ruthenium Sulphur Antimony Scandium Selenium Silicon Samarium Tin Strontium Tantalum Terbium Tellurium Thorium Titanium Thallium Thulium Uranium Vanadium Tungsten Yttrium Ytterbium Zinc Zirconium Rh Ru S Sb Sc Se Si Sm Sn Sr Ta Tb Te Th Ti Tl Tm U V W Y Yb Zn Zr 343.5 349.9 217.6 391.2 196.0 251.6 429.7 235.5 460.7 271.5 432.7 214.3 364.3 276.8 371.8 358.5 318.5 255.1 410.2 398.8 213.9 360.1 ICP 343.489 267.876 180.734 217.581 361.384 196.026 251.611 442.434 242.949 407.771 268.517 350.917 214.281 274.716 334.941 351.924 346.220 385.958 309.311 239.709 371.030 328.937 213.856 339.198 Flame AA Zeeman Furnace AA Detection Characteristic Detection Limit Conc Limit µg/L µg/L µg/L 5 5.5 20 18 0.4 37 5 7 15 0.02 9 5 27 17 0.6 16 1.5 18 2 17 0.2 0.3 0.9 1.5 FlameCharacteristic# Type MSR Conc+ Mass µg/L pg % El 95 100 96 92 100 93 94 90 93 100 63 79 97 92 - Rh Ru S Sb Sc Se Si Sm Sn Sr Ta Tb Te Th Ti Tl Tm U V W Y Yb Zn Zr 100 400 5 100 Air Air 0.4 0.75 8 15 300 300 1000 1500 6000 700 40 10000 7000 200 40 50 500 300 1000 100 2 2000 700 30 Air N2O N2O N2O N2O N2O N2O N2O N2O Air 0.5 10 0.7 0.75 14* 15 0.5 0.1 10* 2 0.18 0.45 3.5 9* 1000 200 300 100000 700 5000 2000 60 8 9000 100 20 20 40000 100 1000 200 4 1.0 1000 N2O Air N2O N2O N2O N2O N2O N2O Air N2O 2.5 0.75 50 15 1.1 22 0.15 3 0.0075 0.15 NOTES: * Modifier used to obtain these results. + 20 µL injection # The Characteristic Masses listed were determined in aqueous solution using maximum heating rate in argon with zero gas flow during atomization. For Deuterium Furnace systems, the equivalent Characteristic Concentration and Characteristic Mass is easily calculated using the following conversion: CMn = CMz X MSR (%)/100 CCn = CCz X MSR (%)/100 where: CMn = Characteristic Mass for Deuterium Furnace Systems CMz = Characteristic Mass for Zeeman Furnace Systems (from Table above) MSR = Magnetic Sensitivity Ratio (as % from Table above) CCn = Characteristic Concentration for Deuterium Furnace Systems CCz = Characteristic Concentration for Zeeman Furnace Systems (from Table above). 6
