Flow under Sluice Gate - The University of Alabama
advertisement

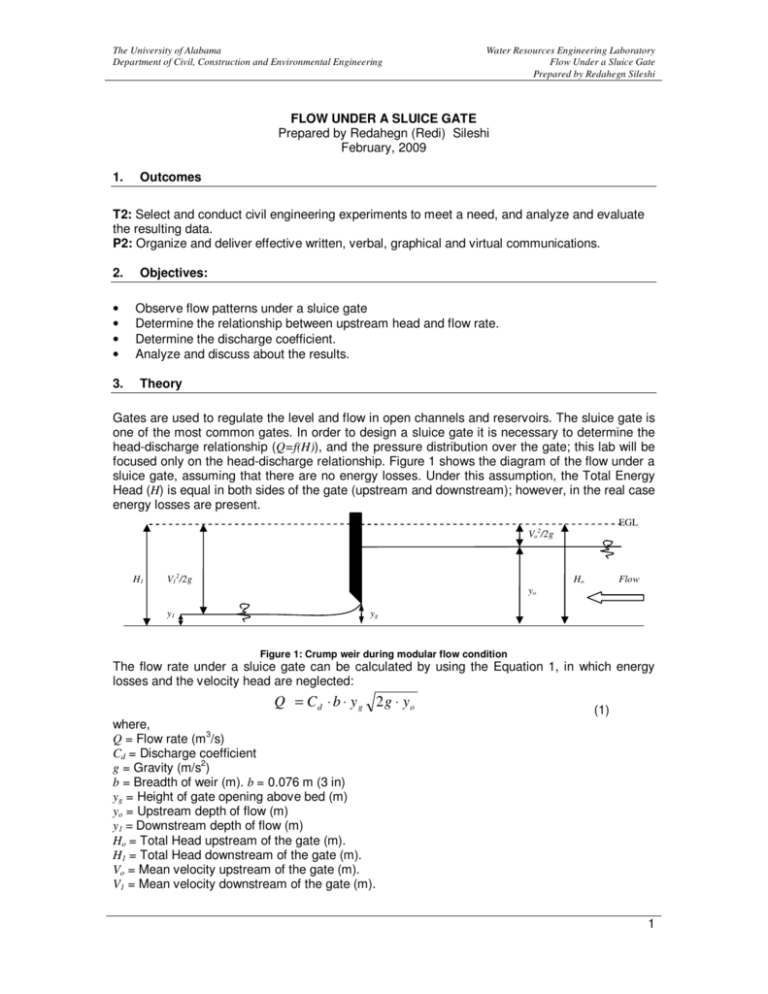
The University of Alabama Department of Civil, Construction and Environmental Engineering Water Resources Engineering Laboratory Flow Under a Sluice Gate Prepared by Redahegn Sileshi FLOW UNDER A SLUICE GATE Prepared by Redahegn (Redi) Sileshi February, 2009 1. Outcomes T2: Select and conduct civil engineering experiments to meet a need, and analyze and evaluate the resulting data. P2: Organize and deliver effective written, verbal, graphical and virtual communications. 2. • • • • 3. Objectives: Observe flow patterns under a sluice gate Determine the relationship between upstream head and flow rate. Determine the discharge coefficient. Analyze and discuss about the results. Theory Gates are used to regulate the level and flow in open channels and reservoirs. The sluice gate is one of the most common gates. In order to design a sluice gate it is necessary to determine the head-discharge relationship (Q=f(H)), and the pressure distribution over the gate; this lab will be focused only on the head-discharge relationship. Figure 1 shows the diagram of the flow under a sluice gate, assuming that there are no energy losses. Under this assumption, the Total Energy Head (H) is equal in both sides of the gate (upstream and downstream); however, in the real case energy losses are present. EGL Vo2/2g H1 V12/2g Ho Flow yo y1 yg Figure 1: Crump weir during modular flow condition The flow rate under a sluice gate can be calculated by using the Equation 1, in which energy losses and the velocity head are neglected: Q = C d ⋅ b ⋅ y g 2 g ⋅ yo (1) where, Q = Flow rate (m3/s) Cd = Discharge coefficient g = Gravity (m/s2) b = Breadth of weir (m). b = 0.076 m (3 in) yg = Height of gate opening above bed (m) yo = Upstream depth of flow (m) y1 = Downstream depth of flow (m) Ho = Total Head upstream of the gate (m). H1 = Total Head downstream of the gate (m). Vo = Mean velocity upstream of the gate (m). V1 = Mean velocity downstream of the gate (m). 1 The University of Alabama Department of Civil, Construction and Environmental Engineering Remember that H = y + 4. V Water Resources Engineering Laboratory Flow Under a Sluice Gate Prepared by Redahegn Sileshi 2 2g Experimental Procedure • The sluice gate will be installed in the flume, which has to be leveled. One vernier is located downstream the weir to measure y1 and the other upstream of the gate to measure yo. The verniers are zeroed with the bed of the channel. • The procedure has two (2) parts: The first part consists of holding a constant upstream depth, yo, by adjusting the gate opening height for each different flow rate (7 flow rates). Hold yo at 120 mm, and start with a flow rate of 0.5 L/s. Adjust the gate opening until the upstream depth of water keeps constant at 120 mm. Record the accurate flow rate, the gate opening, and the downstream depth. Then, increase the flow rate in increments of 0.25 L/s and repeat the procedure. The second part consists of holding a constant flow rate, Q, and increasing gradually the gate opening (10 gate openings). Hold the flow rate at 1.75 L/s (measure the accurate flow rate), and start with an initial gate opening of 20 mm. Wait until the water depth stabilizes and then measure yg, yo, and y1. Finally, increase the gate opening in increments of 3 mm and repeat the procedure. Use the following tables as guide to record the experimental data. Run 1 2 3 4 5 6 7 Experimental data – Constant upstream depth, yo Volume (L) Time (sec) Q (L/s) yo (mm) y1 (mm) 10 10 10 10 10 10 10 Run 1 2 3 4 5 6 7 8 9 10 Volume (L) 10 10 10 10 10 10 10 10 10 10 Experimental data – Constant Flow rate, Q Time (sec) Q (L/s) yo (mm) y1 (mm) yg (mm) yg (mm) 2 The University of Alabama Department of Civil, Construction and Environmental Engineering 5. Water Resources Engineering Laboratory Flow Under a Sluice Gate Prepared by Redahegn Sileshi Calculations For constant upstream depth • • • Calculate the discharge coefficient, Cd, for each run. Plot the discharge coefficient, Cd, as a function of the flow rate (Q). Plot the flow rate (Q) as a function of the gate opening (yg). For constant flow rate • • • • Calculate the discharge coefficient, Cd, for each run. Plot the discharge coefficient, Cd, as a function of the upstream depth (yo). Plot the upstream depth (yo) as a function of the gate opening (yg). Plot the discharge coefficient, Cd, as a function of the gate opening (yg). For both cases, constant upstream depth and constant flow rate • • • 6. 7. Calculate Ho and H1. Plot H1 as a function of Ho. Include in the graph a 45o line, the (Ho, H1) points and a trendline fitted to those points. Specify in detail the title of each graph. Analysis and discussion of the results [4] Comment on the trend of each plot (the relationship of the plotted variables). Comment on effects of yo (when Q is constant) and Q (when yo is constant) on the discharge coefficient Cd for flow under the gate. Which factor has the greatest effect? Compare the values of Ho and H1 and comment on the differences? Describe the flow pattern observed during the experience. Content of the report It is required to submit a formal report by next class. The report should cover the following: 8. Introduction and objectives Theory Experimental procedure Experimental data Calculations: Explain in detail the procedure and include the Excel tables. Analysis and discussion of results References References used for this guide [1] Chin, D.A. Water Resources Engineering, 2nd edition, Prentice Hall, 2006. [2] Sutley, David. An Instruction Manual of Open Channel Hydraulic Experiments for Water Resources Engineering. Thesis. The University of Alabama, 2005. 3 The University of Alabama Department of Civil, Construction and Environmental Engineering Water Resources Engineering Laboratory Flow Under a Sluice Gate Prepared by Redahegn Sileshi [3] Mays, Larry. Hydraulic Design Handbook, McGraw Hill. New York. 1999. [4] Armfield, Instruction Manual for C4 Multi Purpose Teaching Flume. [5] Humberto Avila. Water Resources Engineering laboratory files for Open Channel Hydraulic Experiments . The University of Alabama, 2006-2007. 4


