Lattice Design and Study Tools Regarding the Super
advertisement
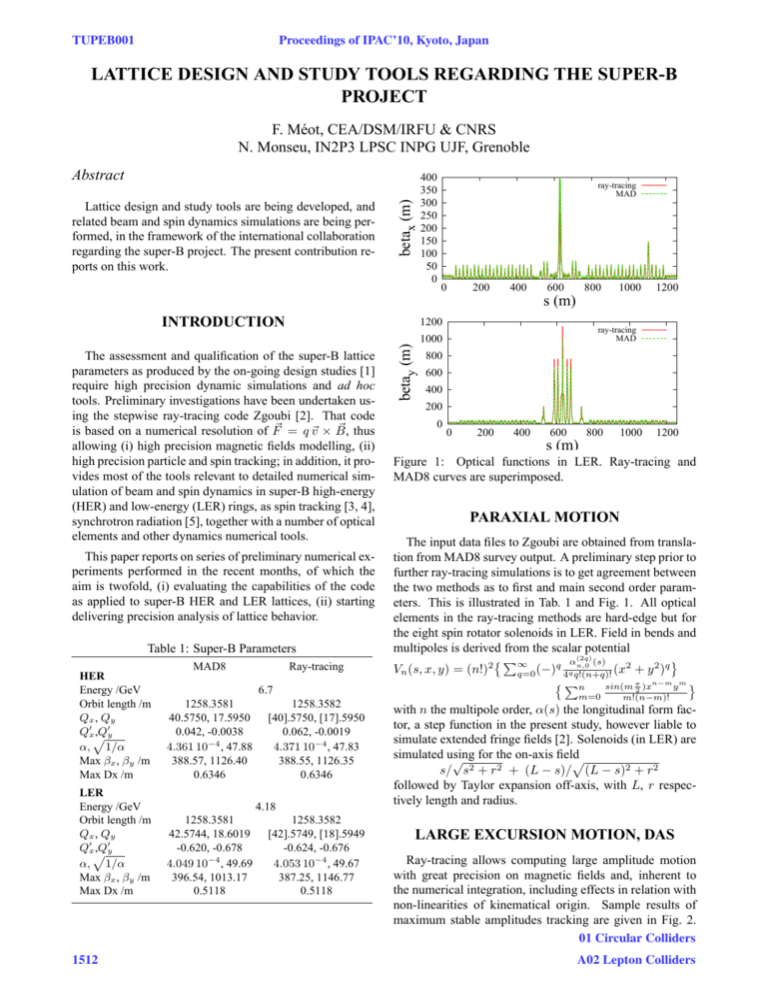
TUPEB001 Proceedings of IPAC’10, Kyoto, Japan LATTICE DESIGN AND STUDY TOOLS REGARDING THE SUPER-B PROJECT F. Méot, CEA/DSM/IRFU & CNRS N. Monseu, IN2P3 LPSC INPG UJF, Grenoble Lattice design and study tools are being developed, and related beam and spin dynamics simulations are being performed, in the framework of the international collaboration regarding the super-B project. The present contribution reports on this work. betax (m) Abstract 400 350 300 250 200 150 100 50 0 ray-tracing MAD 0 200 400 600 800 1000 1200 s (m) INTRODUCTION The assessment and qualification of the super-B lattice parameters as produced by the on-going design studies [1] require high precision dynamic simulations and ad hoc tools. Preliminary investigations have been undertaken using the stepwise ray-tracing code Zgoubi [2]. That code thus is based on a numerical resolution of F = q v × B, allowing (i) high precision magnetic fields modelling, (ii) high precision particle and spin tracking; in addition, it provides most of the tools relevant to detailed numerical simulation of beam and spin dynamics in super-B high-energy (HER) and low-energy (LER) rings, as spin tracking [3, 4], synchrotron radiation [5], together with a number of optical elements and other dynamics numerical tools. This paper reports on series of preliminary numerical experiments performed in the recent months, of which the aim is twofold, (i) evaluating the capabilities of the code as applied to super-B HER and LER lattices, (ii) starting delivering precision analysis of lattice behavior. Table 1: Super-B Parameters MAD8 HER Energy /GeV Orbit length /m Qx , Qy ,Qy Qx α, 1/α Max βx , βy /m Max Dx /m 1258.3581 40.5750, 17.5950 0.042, -0.0038 4.361 10−4 , 47.88 388.57, 1126.40 0.6346 LER Energy /GeV Orbit length /m Qx , Qy ,Qy Qx α, 1/α Max βx , βy /m Max Dx /m 1258.3581 42.5744, 18.6019 -0.620, -0.678 4.049 10−4 , 49.69 396.54, 1013.17 0.5118 1512 Ray-tracing 6.7 1258.3582 [40].5750, [17].5950 0.062, -0.0019 4.371 10−4 , 47.83 388.55, 1126.35 0.6346 4.18 1258.3582 [42].5749, [18].5949 -0.624, -0.676 4.053 10−4 , 49.67 387.25, 1146.77 0.5118 betay (m) 1200 ray-tracing MAD 1000 800 600 400 200 0 0 200 400 600 800 1000 1200 s (m) Figure 1: Optical functions in LER. Ray-tracing and MAD8 curves are superimposed. PARAXIAL MOTION The input data files to Zgoubi are obtained from translation from MAD8 survey output. A preliminary step prior to further ray-tracing simulations is to get agreement between the two methods as to first and main second order parameters. This is illustrated in Tab. 1 and Fig. 1. All optical elements in the ray-tracing methods are hard-edge but for the eight spin rotator solenoids in LER. Field in bends and multipoles is derived from the scalar potential (2q) ∞ q αn,0 (s) 2 2 q Vn (s, x, y) = (n!)2 q=0 (−) 4q q!(n+q)! (x + y ) n sin(m π )xn−m y m m=0 2 m!(n−m)! with n the multipole order, α(s) the longitudinal form factor, a step function in the present study, however liable to simulate extended fringe fields [2]. Solenoids (in LER) are simulated using √ for the on-axis field s/ s2 + r2 + (L − s)/ (L − s)2 + r2 followed by Taylor expansion off-axis, with L, r respectively length and radius. LARGE EXCURSION MOTION, DAS Ray-tracing allows computing large amplitude motion with great precision on magnetic fields and, inherent to the numerical integration, including effects in relation with non-linearities of kinematical origin. Sample results of maximum stable amplitudes tracking are given in Fig. 2. 01 Circular Colliders A02 Lepton Colliders Proceedings of IPAC’10, Kyoto, Japan Horizontal Zgoubi|Zpop 21-Mar-10 Y’ Vertical (rad) vs. Y Zgoubi|Zpop 17-Mar-10 (m) Z’ (rad) vs. Z (m) 0.0002 0.001 TUPEB001 Table 2: Theoretical Parameters Entering SR Simulations in LER 0.00015 Synchronous energy Es Orbit length Revolution time Average energy loss /particle/turn, Eloss Equivalent ρ, 88.5Es4 [GeV ]/Eloss [keV ] V̂ sin(φs ) 0.0001 0.0005 0.5 E-4 0.0 0.0 -0.5 E-4 -.0005 -.0001 -.00015 17 Mar 10 17 Mar 10 0.001 0.0002 0.00015 0.0005 GeV m μs keV m kV 4.18 1258 4.20 865 31.2 865.13 0.0001 0.5 E-4 0.0 0.0 -0.5 E-4 -.0005 -.0001 -.00015 21 Mar 10 17 Mar 10 0.0002 0.001 0.00015 0.0001 0.0005 0.5 E-4 0.0 0.0 -0.5 E-4 -.0005 -.0001 -.00015 -.004 -.002 0.0 0.002 0.004 -.006 -.004 -.002 0.0 0.002 0.004 0.006 Figure 2: Maximum stable motion in HER, from raytracing, dp/p = +1%, 0, −1% from top to bottom row. Comparisons with MAD8 have been undertaken [6] as it is often taken as a reference in the literature, it has been observed that strong discrepancies arise; given this, comparisons with other numerical methods are in order. Dynamic apertures are obtained by repeating maximum stable H and V amplitude search above, that yields DAs in HER and LER are shown in Fig.3, as observed at center of QDI, RF section, over 1000 turns - the damping time is ≈5000 turns, see next Section. 0.7 dp +1% dp +0.5% dp 0 dp -0.5% dp -1% 0.6 y (cm) 0.5 0.4 0.3 0.2 0.1 0 -0.5 -0.4 -0.3 -0.2 -0.1 0 0.1 0.2 0.3 0.4 0.5 x (cm) 1.2 dp +1% dp +0.5% dp 0 dp -0.5% dp -1% y (cm) 1 0.8 0.6 0.4 p(k) = λ−k exp(−k) / k! √ with λ = 20er0 β 2 Bρ Δs / 8h̄ 3 the mean number of photons per radian, and r0 = e2 /4π0 m0 c2 the classical radius of the particle, e the elementary charge, h̄ = h/2π, h the Planck constant, β = v/c, Bρ the particle stiffness. λ is evaluated at each integration step from the current values β, Bρ and Δs, then a value of k is drawn by a rejection method. These k photons are assigned energies = hν at random, in the following way. The cumulative distribution of the energy probability law p(/c )d/c writes /c ∞ 3 K5/3 (x)dx P(/c ) = 5π /c 0 with K5 /3 the modified Bessel function, c = h̄ωc , ωc = 2π3γ 3 c/2ρ the critical frequency of the radiation in constant field with bending radius ρ; ωc is evaluated at each integration step from the current values γ and ρ (assumes constant magnetic field over Δs). Quantities in the “theoretical” column in Tab. 3 derive from the following regular expressions : Let ei [keV ] = 88.5E 4 [GeV ] αi /2π be the energy loss in dipole i (of N in the ring) characterized by its deviation αi with local radius ρi , and i = 0.683E 3 [GeV ]/ρi [m] the average photon N energy, then, energy loss per particle dipoles; numEloss [keV ] = i ei , a sum over the N N = ber of photons per particle, N phot i /i ; beam i e√ σE /E = γ Cq / 2ρ with Cq = 55h̄/32 3m0 c ≈ 3.84 10−13 ; damping time τE [turns] = Es /Eloss , τE [ms] = 4.2 10−3 Es /Eloss . The stepwise SR simulation method yields equilibrium emittances and other parameters as damping times, H̄, etc. Simulations have been realized with the hypotheses gathered in Tab. 2. SR in the sole dipoles is assumed here, whereas the code allows switching SR in other magnets. Note that the quantities in Tab. 2, Eloss = 865.13 keV, Nphot = 541, Ephot = 3.45 keV as obtained from theTable 3: SR in LER, Comparing Theoretical and Monte Carlo Data 0.2 0 -0.8 -0.6 -0.4 -0.2 0 0.2 0.4 0.6 0.8 x (cm) Figure 3: 1000-turn DA in HER (top) and LER (bottom). EQUILIBRIUM EMITTANCES Stochastic synchrotron radiation and its effects on particle dynamics are simulated in a very regular manner, as follows [2, 5]. The number of photons, k, emitted in a step Δs is given by Eloss Nphot x /π τx σE /E τE keV theoretical 865.1 541.4 1.8 10−9 ms ms 0.67 10−3 20.3 Zgoubi 878.4 541.3 1.4 10−9 (a) ≈ 28 (b,a) 0.68 10−3 (c) ≈ 15 (b,c) (a) After Fig. 4-top. (b) Taken at 1/e of initial amplitude. (c) After Fig. 4-bottom. 01 Circular Colliders A02 Lepton Colliders 1513 TUPEB001 Proceedings of IPAC’10, Kyoto, Japan x 0.0008 (m) vs. Time (mu_s) 0.0006 0.0004 0.0002 0.0 -.0002 -.0004 -.0006 1. E+4 2. E+4 y 0.6 E-4 3. E+4 4. E+4 (m) 5. E+4 vs. 6. E+4 Time 7. E+4 δp/p = +1.252% chromatic closed orbit. An other way to find the n0 (s) is the stroboscopic averaging [7] method, This second method permit to get rid of closed orbit, and allow full phase space study, especially with synchrotron radiation allowing spin diffusion, work is being carried on. (mu_s) 0.4 E-4 Sx (longitudinal) Sy (transverse horizontal) Sz (transverse vertical) 1 0.2 E-4 0.0 0.5 spin n0 components -0.2 E-4 -0.4 E-4 1. E+4 2. E+4 dp/p 3. E+4 4. E+4 vs. 5. E+4 Time 6. E+4 0 7. E+4 -0.5 (mu_s) 0.006 0.004 -1 -0.015 0.002 -0.01 -0.005 0 0.005 0.01 0.015 dp/p0 (%) 0.0 Sx (longitudinal) Sy (transverse horizontal) Sz (transverse vertical) 1 -.002 -.004 2. E+4 3. E+4 4. E+4 5. E+4 6. E+4 7. E+4 Figure 4: 20000-turn tracking, reaching equilibrium in presence of synchrotron radiation. Top and middle : respectively x-motion and y-motion, starting with pure x; bottom: starting with pure dp/p. spin n0 components 0.5 1. E+4 0 -0.5 -1 -0.015 -0.01 -0.005 0 0.005 0.01 0.015 dp/p0 (%) Figure 6: Spin components at the IP (up) and RF (down) section in function of momentum. 1. Sy 0.5 Sx COMMENTS 0.0 -.5 Ss -1. 450 500 550 600 s (m) 650 700 750 800 Figure 5: Spin components in IR region (spin is vertical, Sy ≡ 1, elsewhere). oretical radiation formulas are identical to those obtained from the stochastic method. Sample behavior is displayed in Fig. 4 : a particle is launched with either x motion or non-zero dp/p, equilibrium of respectively x /π ≈ 1.5 nm, σdE/E ≈ 6.5 10−4 are reached. Given the acute insight in the physics which the raytracing tool allows, checks as well as tight comparisons with theory and other codes are considered worth being carried on. It is foreseen to explore further analysis methods as frequency map techniques, based on Zgoubi outputs. Sokholov-Ternov effect will be implemented - however the time scale in super-B lattice is a priori well beyond storage time scale. Implementation of beam-beam effects is being contemplated. REFERENCES [1] http://www.pi.infn.it/SuperB SPIN MOTION [2] The ray-tracing code Zgoubi, F. Méot, NIM-A 427 (1999) 353-356; http://sourceforge.net/projects/zgoubi/ Thomas-BMT equation for spin motion is solved simultaneously with particle motion, if requested [3]. In LER, the spin vector of the electron beam has to be longitudinal at the interaction point. This is ensured by means a rotator comprised of two sets of four solenoids, located on both sides of the IR. One way to find the n0 (s) spin vector is to use the built-in fitting procedure in Zgoubi, with constraint of identical spin coordinates after one turn (Fig 6). n0 (s) is vertical in the arcs at appropriate momentum; it is then clear that the method can be used for adjusting the rotator and IR bends so to reach longitudinal polarization at IP. Typical spin behavior for the present tuning of V12 optics is displayed in Fig. 5; improvement is being carried on, in particular it has to be noted that the conditions of vertical n0 (s) in the arcs as displayed in Fig. 5 are for [3] A numerical method for combined spin tracking and ray tracing of charged particles, F. Méot, NIM A 313 (1992) 492-500. [4] Spin dynamics simulations at AGS, H. Huang et al., these proceedings; Commissioning RHIC spin flipper, M. Baı̈ et al., these proceedings. [5] Numerical tools for the simulation of SR loss and induced dynamical effects in high energy transport lines, F. Méot, J. Payet, Report CEA DSM DAPNIA/SEA-00-01 (2001). [6] Optical parameters in the HER and LER super-B V12 rings, from ray-tracing, F. Méot, N. Monseu, Note IN2P3/LPSC10-30 (2010). [7] A tracking algorithm for the stable spin polarisation field in storage rings using stroboscopic averaging, K. Heinemann and G. H. Hoffstätter, DESY Report 96-078. 01 Circular Colliders 1514 A02 Lepton Colliders

