Small population biology
advertisement
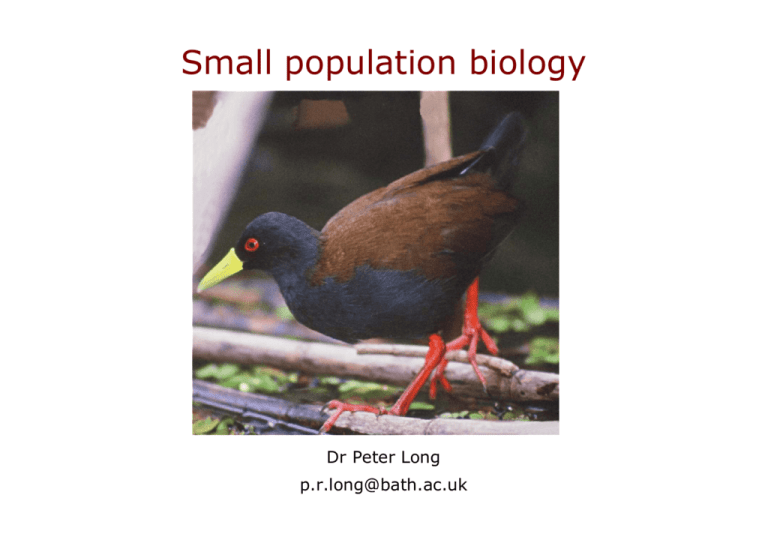
Small population biology Dr Peter Long p.r.long@bath.ac.uk Small populations Mauritius kestrel Hawaiian palm Large blue butterfly Hainan gibbon Sakalava rail Black-footed ferret Why are small populations important? -Population size is the single most important factor affecting persistence or population viability -Small populations are affected by small population processes which can cause them to decline. -Population size is an important criterion for prioritisation -Small populations are often found on islands -Relevant to in-situ and ex-situ conservation Approaches to species conservation Declining population paradigm Identify the causes of decline and reverse threats. Small population paradigm Finding solutions to the problems caused by small population size. ‘Conservation biology focuses on managing small populations, and this requires estimating their viability (or vulnerability to extinction) so that appropriate management action can be taken.’ Lindenmayer (1993) Extinction Extinct -Not reliably observed for 50 years eg. Dodo Extirpated -Local extinction eg. Wolves in the UK Extinct in the wild -Not reliably observed for 50 years in the wild -Ex-situ (zoos/botanic gardens) population Eg. Wood’s cycad, Guam rail, Spix macaw, Smallpox Extinction Functionally extinct -When only one individual (or one gender) remains eg. Lonesome George Ecologically extinct -Present at such low density that has no impact on the ecosystem eg. Javan rhinoceros Rarity Geographical range Habitat specificity Large Small Wide Narrow Wide Narrow Large population size - Rare Rare Rare Small population size Rare Rare Rare Rarest Rabinowitz (1981) Lecture overview - Important concepts in population biology - Small population processes - Introduction to conservation genetics - Modelling small populations - Diagnosing declines Population dynamics - Births Deaths Emmigration Immigration Nt+1 = Nt + Births – Deaths + Emmigration - Immigration These numbers are affected by both deterministic and stochastic factors. Deterministic factors - Habitat loss - Overexploitation - Pollution - Introduced species - Chains of extinction Stochastic factors - Demographic - Environmental - Genetic - Catastrophes Population growth • • • • If unlimited resources dN/dt = Births-Deaths dN/dt = rN r = intrinsic rate of increase • Intra-specific competition for resources • Per capita birth rate decreases • K = carrying capacity • Growth rate depends on population density • ie ‘Density dependence’ r and K selection A continuum that describes life history patterns r = intrinsic rate of increase K = carrying capacity r- and K-selecting habitats r and K selected species MacArthur & Wilson (1967) r and K selected species r selection K selection Rate of popn growth is Rate of popn growth is Limited by the environment Limited by reproductive rate Small size eg. rat Large size eg. elephant Short lifespan Long lifespan Many offspring, little investment in each Few offspring, large investment in each Density dependence Population density can affect competition for resources, birth rates, death rates and dispersal. Low density More resources per capita High density Fewer resources per capita Mortality relatively low Mortality relatively high Reproductive output relatively high (unless Allee effect) Reproductive output relatively low Little disease More disease Rapid growth Slow/negative growth Survivorship Limitation vs regulation Do populations persist in the long term through stability (populations are regulated) or through a series of setbacks and recovery (populations are limited)? i.e. are density dependent or density-independent factors the most important in controlling population size? Nicholson (1954) vs Andrewartha & Birch (1954) A massive argument in ecology! But these guys were arguing about separate processes Limitation vs regulation Limitation is the processes that set the population equilibrium Regulation is the process by which a population returns to its equilibrium. Regulation by definition occurs only as a result of one or more density dependent processes that act on rates of birth, death and/or movement through a negative feedback mechanism Population persistence requires that density dependent processes operate - no population can be absolutely free of regulation In reality a combination of limiting and regulating factors control populations What does this mean in practice? Food supply is primary factor determining population growth rate. But it can be over-ridden by three secondary processes; predators, social interactions within species and stochastic disturbances Birds – food supply and social interactions Large mammals – food supply and rarely predation Small mammals – predation and social interactions Fish, Herps and Inverts – stochastic disturbances affecting recruitment through food limitation Metapopulations • Landscapes tend to be patchy • A series of localised populations linked by dispersal • Persistence occurs when overall colonisation rates exceed extinction rates • Movement stabilises the overall population • Hanski (1991) The extinction vortex Deterministic factors Habitat loss, Overexploitation, Pollution, Introduced species, Chains of extinction Small, fragmented, isolated populations Reduced reproduction and survival Inbreeding, loss of genetic diversity Increased disease susceptibility Small population processes - Demographic stochasticity - Environmental stochasticity - Genetic stochasticity - Catastrophes -Allee effect (negative density dependence) -Special types of exploitation (eg. Scarcity value and Bali starlings) Demographic stochasticity Variation in numbers of individuals of a particular age and sex due to chance variation in birth and death rates leads to variation in effective population size Ne. Imagine a population of a monogamous species with 10 females and 3 males Nc = 13 Ne = 6. It is also possible to estimate Ne over time and in different breeding systems. Demographic stochasticity Eg. - Sex-specific death rate eg 7 out of 9 Lord Howe woodhen that died in a 2-year period in the 1980s were female. - Sex ratio eg Fiordland population of Kakapo in New Zealand – 18 males persisted for 10 years after the last female died. Extirpation in 1987. Merton (1989). Environmental stochasticity -Random environmental changes affect small populations very severely. - Climate eg. droughts, floods - Variations in food abundance - Effects of invasive species eg. Mast-fruiting in Dipterocarps affects frugivores in SE Asian forests. Eg. Periodic bamboo flowering and giant pandas. Genetic stochasticity Small populations have low genetic diversity (allelic diversity and heterozygosity). Founder effects There is only a limited sub-set of genes in founder individuals. Genetic bottlenecks Populations that go through a contraction lose the unique genes present on those that die without reproducing. Genetic drift Random loss of genes between generations. Increased chance of inbreeding Raises homozygosity, deleterious genes more likely to be expressed. Genetic stochasticity Fisher’s fundamental theorem Rate of evolutionary change is proportional to genetic diversity in a population. Deleterious genes… -Are usually recessive -Reduce inclusive fitness -Are more likely to be expressed when mating occurs between relatives. Eg. A skeletal disorder, Chondrodystrophy in California condors caused by a recessive autosomal allele. Catastrophes - Volcanic eruptions eg Montserrat - Cyclones eg Indian ocean islands - Lightning strikes/severe fires N.B can occur at a range of spatial scales Allee effects -Negative population growth at low population densities due to disruption of interaction between individuals. - eg. Puerto Rican parrots only reproduce in colonies. When population density fell below a particular threshold there was no reproduction. -eg. Brown bears and cougars occur at very low densities in N. America. Often hard to physically find a mate. -Possibly also a problem for blue whales Conservation genetics The science of the genetic factors that affect extinction risk and the management actions which can minimise these risks. Concept map Evolutionary genetics Understanding species biology Forensics Genetic management Taxonomic uncertainty Population structure (fragmentation) Conservation genetics Outbreeding Small populations Inbreeding Loss of genetic diversity Fitness Extinction Identification of management units in wild and/or captivity Introgression Reintroductions Mutational accumulation Uses of conservation genetics - Reducing extinction risk by minimizing loss of genetic diversity Eg. Captive management of Golden Lion Tamarin, Management of wild Florida panthers - Identifying populations of concern Eg. Asiatic lions, Wollemi pine - Resolving population structure Eg. Red-cockaded woodpecker - Resolving taxonomic uncertainty Eg. Tuataras, Velvet worms - Defining management units Eg. Kentish plover/Snowy plover Uses of conservation genetics - Detecting hybridisation Eg. Many plants, salmonid fish, Ethiopian wolf - Non-intrusive sampling Eg. Giant pandas - Defining sites for re-introductions Eg. Northern hairy-nosed wombat, Laysan duck - Choosing populations for re-introductions Eg. Black-footed wallabies - Forensics Eg. Whales - Understanding species biology Eg. Chimpanzees Modelling small populations Three approaches: - Population models (consider total population size) Eg r models - Matrix models (consider numbers in age classes) Eg Leslie matrices - Individual models (consider every individual) -Eg VORTEX An example of a population model The imaginary parrot is endemic to a small island. We can use data on total population size in a time series to estimate r, the intrinsic rate of increase. N.B. Made-up data and simplifying assumptions. Year (t) Population (N) 2000 2632 2001 2132 2002 1954 2003 1900 2004 1638 2005 1612 Decline of the imaginary parrot Population size (N) 3000 2500 2000 1500 1000 500 0 2000 2001 2002 2003 Year (t) 2004 2005 What is r? r is the intrinsic rate of population growth. If r is 0 the population is stationary, if r is positive the population is growing, if r is negative the population is declining. For declining populations, we are interested in the mean r value and its variance. The magnitude of r measures the rate of decline. The variance in r measures how stochastic this decline is. The antilog of r is net survival (the proportion of individuals that survive each year). The r value lets you estimate the population size in the future. How to calculate r dN = rN dt Exponential model of population growth N t = N t −1e r N t / N t −1 = e r Expressed as number (N) at time t r = ln( N t / N t −1 ) Make r the subject Re-arranged Year(t) 2000 2001 N 2632 2132 lnN 7.875 7.665 Nt/Nt-1 r=ln(Nt/Nt-1) 0.810 -0.211 2002 2003 2004 2005 1954 1900 1638 1612 7.578 7.550 7.401 7.385 0.917 0.972 0.862 0.984 -0.087 -0.028 -0.148 -0.016 r = -0.098 What can we do with this? r = -0.098 You can take the antilog to get net survival. Net survival = e-0.098 = 0.907 This means that only 91% of the parrots alive in year t will be alive in year t+1 To work out the population size n years in the future use: Nt+n = Nt * net survival n Eg. How many will there be in 2008? Our latest estimate for the population size, Nt is 16122005 N2005+3 = 16122005 * 0.9073 = 1203 So when will the parrot go extinct? The parrot is functionally extinct when Nt+n= 1 Net survival=0.907 Our latest estimate for the population size Nt = 16122005 Substituting and solving for n, we can find when the parrot goes extinct: N t +n = N t * Net survival n 1 = 1612 20050.907 n 1 = 0.907 n 1612 2005 ⎛ ⎞ 1 ⎟⎟ = n ln 0.907 ln⎜⎜ ⎝ 1612 2005 ⎠ ⎛ ⎞ 1 ⎟⎟ ln⎜⎜ 1612 2005 ⎠ ⎝ n= = 76 ln 0.907 2005 + 76 = 2081 Matrix models eg. Leslie matrices Consider numbers of individuals in a several age classes. Estimate net survivorship in each age class over each time period. Eg. What proportion of parrots survive their first year? What proportion survive their second year? Etc. Models of total population size assume Type II survivorship (linear). Matrix models can incorporate other, more realistic, types of suvivourship eg. Type I (r-selected species) or Type III (K-selected species). Deterministic vs stochastic models A deterministic model gives a definite answer. A stochastic model gives an answer and a confidence interval which reflects uncertainty in the data. Deterministic model Stochastic model Nt=100 Nt=100 +12 births -6 deaths +12±3 births -6±2 deaths Nt+1=106 Nt+1=106±5 (display as a histogram) Individual models Eg VORTEX, RAMAS, GAPPS Individual-based models Inputs: -Life-history -Age structure -Inbreeding depression -Environmental variation -Catastrophes -Carrying capacity -Threats Stochastic population model Outputs: -Population size -Probability of viability -Loss of genetic diversity For a review see Coulson et al. (2001) Can use VORTEX to model persistence under different management scenarios (Sommer et al. 2002) Diagnosing declines • Manipulate factor to achieve population growth • Very difficult! • Mechanistic and density paradigms • Experimental conservation biology and evidence-based conservation Monitoring programme Analysis Population growth rate • Vital for conservation Factor of decline Species management actions Diagnosing causes of decline Lord Howe woodhen is a flightless rail endemic to Lord Howe island (25km2). Settled in 1834 and dogs, pigs, rats were introduced. Woodhens became confined to two mountainous summits surrounded by sheer cliffs. Sub-optimal habitat. In 1969 monitoring started. 20-25 individuals. Low productivity. Very wet winter in 1978. In 1980 only 12 individuals on Mt. Gower. Why was productivity low? Rats, cats, owls, pigs? Detailed studies showed pigs were limiting. 180 pigs shot. Intensive management led to recovery. Miller & Mullette (1985) Summary: risk factors - Island endemics/restricted range eg. Mauritius kestrel - K strategists eg. Rhinos - Species at high trophic levels eg. Big cats - Allee effect susceptible species eg. Puerto Rican parrot - Species with large home ranges eg. jaguars - Species susceptible to hunting eg. duikers - Niche specialists eg. Spotted owls Further reading Pullin (2002) Chapter 10 Groom et al. (2005) Caughley & Chapters 11 and 12 Gunn (1996) Chapters 6, 7, 8 and 9 Frankham, Ballou & Briscoe (2002) Chapters 1, 10 References Rarity Rabinowitz, D. (1981) Seven forms of rarity. The biological aspects of plant conservation. Wiley. Conservation biology paradigms * Caughley G (1994) Directions in conservation biology. Journal of Animal Ecology 63: 215-244 Population dynamics Sibly, R.M., J. Hone & T.H. Clutton-Brock. (2003) Wildlife Population Growth Rates. Cambridge University Press, UK. * Sinclair, A.R.E. (1989) Population regulation in animals. In. Ecological Concepts (ed JM Cherrett). pp197-242. Blackwell Scientific Publications, Oxford Sinclair, A.R.E. & Pech, R.P., Dickman, C.R., Hik, D., Mahon, P. & Newsome, A.E. (1998) Predicting the effects of predation on conservation of endangered prey. Conservation Biology, 12, 564-575. Metapopulations Hanski, I. (1999) Metapopulation Ecology. Oxford University Press, Oxford Small populations Miller B, Mulltee KJ (1985) Rehabilitation of an endangered Australian bird: the Lord Howe island woodhen Tricholimnas sylvestris (Sclater). Biological Conservation 34: 55-95 Genetics Frankham R, Ballou JD, Briscoe DA (2002) Introduction to conservation genetics. Cambridge University Press. Population models Coulson T, Mace GM, Hudson E, Possingham H, (2001) The use and abuse of population viability analysis. Trends in Ecology and Evolution 16(5): 219-221
